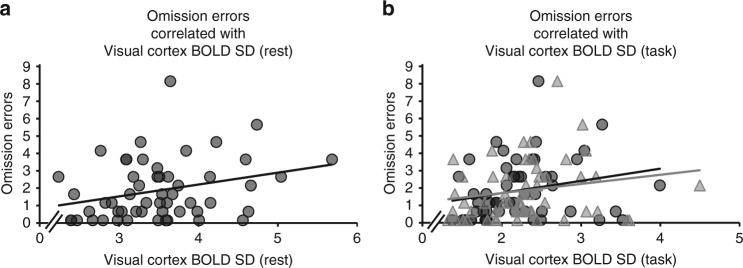
Fig. 2.
BOLD variance is positively associated with omission errors during visual detection. Pearson correlations that accounted for the dependence among the repeated measures, were calculated to study the relationship between behavior and BOLD SD in visual cortex during rest (a) and task (b). a Individual resting-state BOLD SD values in visual cortex (extracted from cluster 1, x-axis) correlated positively with individual omission errors during visual detection (y-axis) at the same times of day (r = 0.54, n = 54, P < 0.001). The scatter plot shows individual resting-state BOLD SD values and corresponding omission errors for all ToD (linear regression line of best fit included in the graph). b Correlation between omission errors and BOLD SD persisted during visual detection, linking BOLD SD reductions to performance (y-axis: omission errors; x-axis: BOLD SD during visual detection task). BOLD SD values were extracted from the cluster in the primary and secondary visual cortex (circles: r = 0.43, P = 0.003, n = 54. Local maxima in the left calcarine sulcus (MNI −10 −68 12) and left lingual gyrus (MNI −8 −66 2), see Fig. 3) and from the cluster in the secondary visual cortex (triangles: r = 0.42, P = 0.004, n = 54. Local maxima in the left (MNI −2 −82 24) and right cuneus (MNI 4–82 20), see Fig. 3). The scatter plot shows individual BOLD SD values during visual detection and corresponding omission errors for all ToD (linear regression line of best fit included in the graph)

