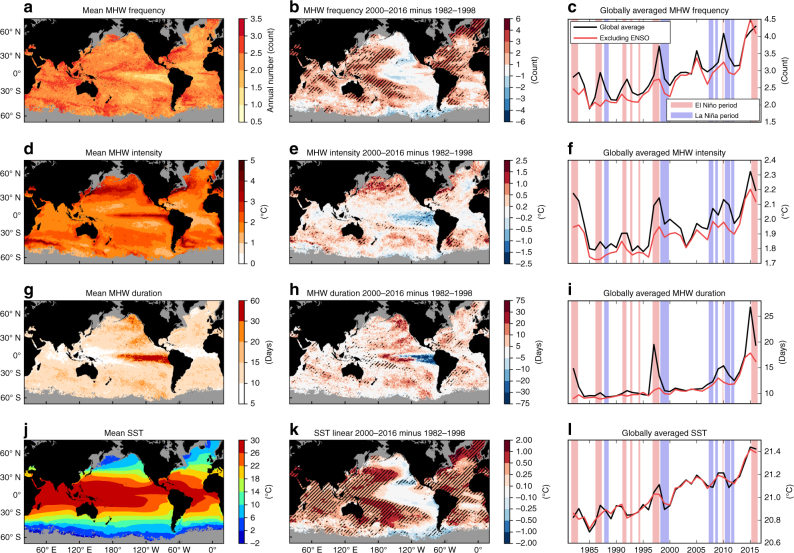
Fig. 1.
Global sea surface temperature and marine heatwave properties. a, d, g, j Mean over the 1982–2016 period, b, e, h, k difference between the 1982–1998 and 2000–2016 periods, and c, f, i, l globally averaged time series of annual mean a–c marine heatwave (MHW) count, d–f MHW intensity, g–i MHW duration and j–l SST from NOAA OI SST over 1982–2016. In b, e, h and k, hatching indicates the change is significantly different from zero at the 5% level. In c, f, i and l, the black lines show the globally averaged time series and red lines show a global average after removing the signature of ENSO. In c, f, i and l, the light red and blue shading indicate El Niño and La Niña periods, respectively, defined by periods exceeding ±1 s.d. of the MEI index for at least three consecutive months

