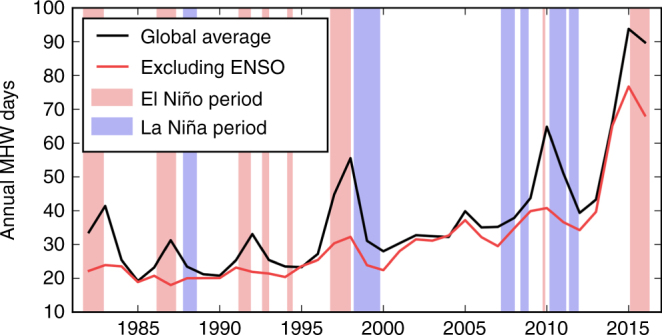
Fig. 2.

Total number of marine heatwave days globally. Globally averaged time series of total marine heatwave (MHW) days from NOAA OI SST over 1982–2016. The black line shows the globally averaged time series of total MHW days from NOAA OI SST over 1982–2016. The red line shows this metric after removing the signature of ENSO. The light red and blue shading indicate El Niño and La Niña periods, respectively, defined by periods exceeding ±1 s.d. of the MEI index for three consecutive months
