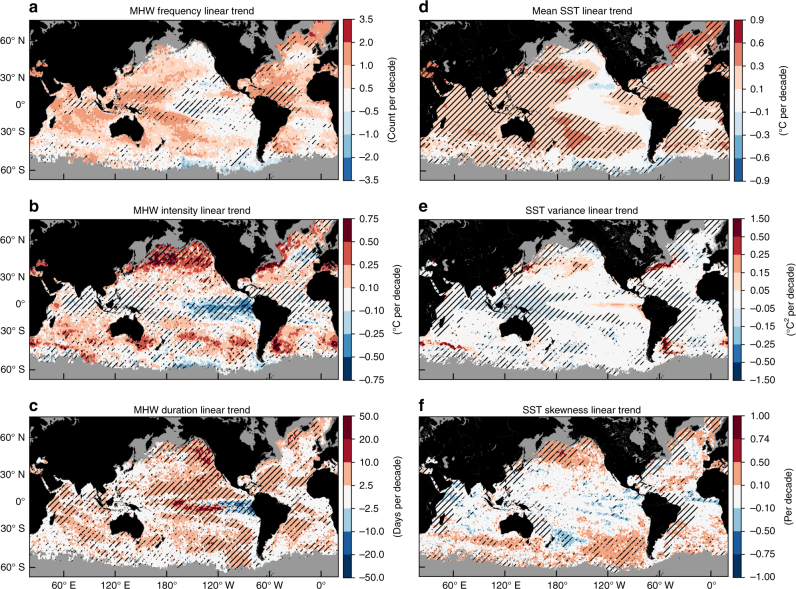
Fig. 3.
Identification of excess trends in marine heatwave properties globally. Shown are linear trends in a marine heatwave frequency, b marine heatwave intensity, c marine heatwave duration, d annual mean SST, e annual SST variance and f annual SST skewness from NOAA OI SST over 1982–2016. Hatching in a–c indicates the linear trend is significantly different from what is expected solely due to the rise in the annual mean SST (at the 5% level), based on the statistical climate model. Hatching in d–f indicates the linear trend is significant from zero (p < 0.05)

