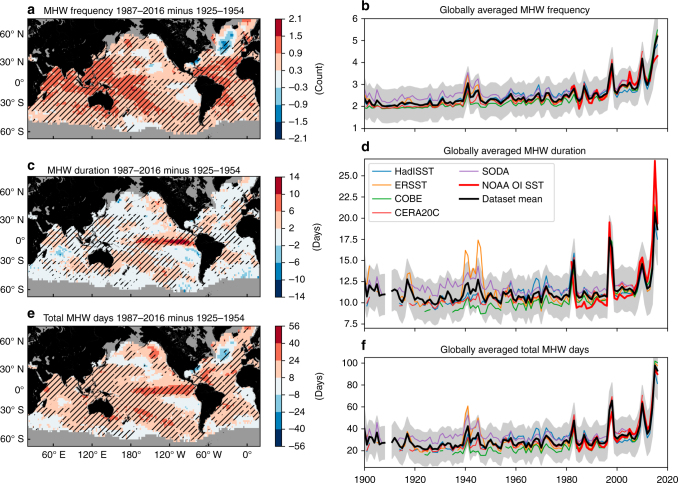
Fig. 5.
Centennial-scale changes in marine heatwave proxies derived from monthly gridded sea surface temperature data sets. a, c, e Difference between 1925–1954 and 1987–2016 and b, d, f globally averaged time series of annual a, b marine heatwave (MHW) frequency, c, d MHW duration and e, f total MHW days based on monthly proxies derived from all proxy data sets (data set mean) over 1900–2016. In a, c,e, hatching indicates that all five data sets agreed on the sign of the change (corresponding to 5% significance based on a binomial distribution) and grey areas indicate no data. The equivalent maps for each individual data set can be found in Supplementary Fig. 4. In b, d, f, globally averaged time series of MHW properties are shown for (thick red line) the NOAA OI SST 1982–2016 data, (thin coloured lines) the individual proxy data sets and (thick black line) the mean across all five proxy data sets. The shaded areas show the 95% confidence intervals based on proxy model errors, averaged across the five data sets (taking into account temporal covariance)

