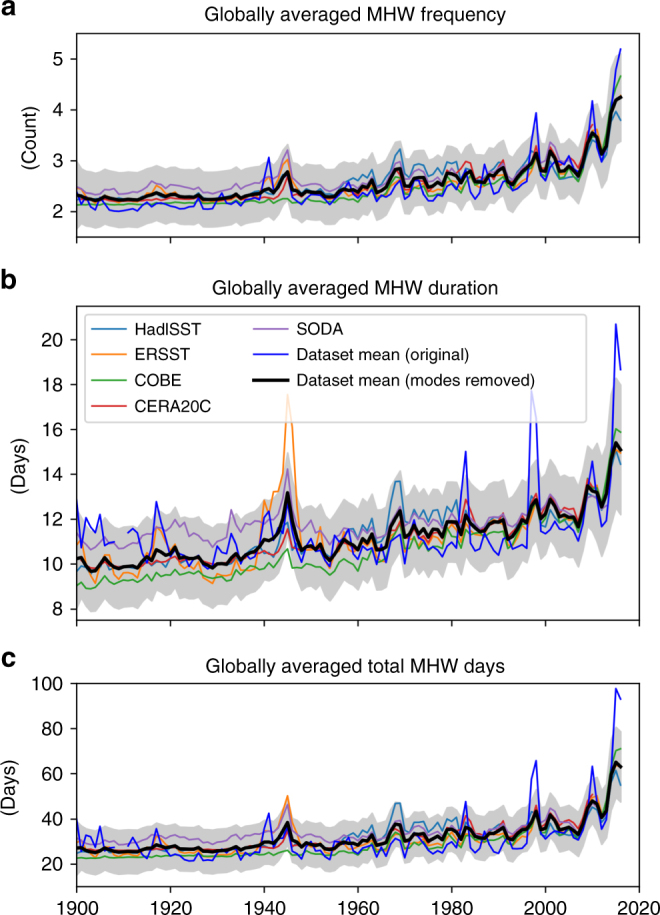
Fig. 6.

Influence of climate modes on marine heatwaves globally. Globally averaged time series of annual (first row) marine heatwave (MHW) frequency, (second row) duration and (third row) total MHW days based on monthly proxies over 1900–2016. Shown are the original results which include the influence of major global-scale climate modes (i.e., ENSO, PDO, AMO; blue lines) and results after the removal of their global signature (thin coloured lines and thick black lines). The shaded areas show the 95% confidence intervals based on model errors, averaged across proxy data sets (taking into account temporal covariance; after removal of climate modes). Note that the blue lines in this figure are identical to the black lines in Fig. 5
