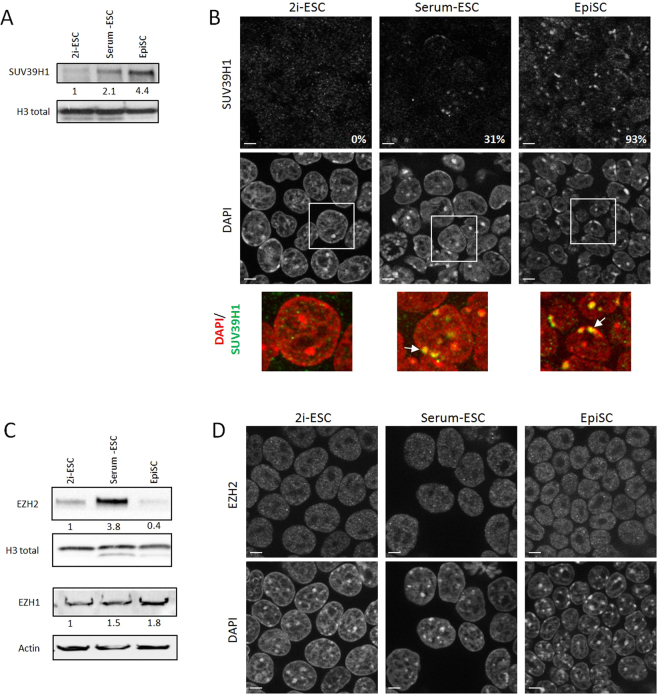
Figure 2.
Expression and pattern of epigenetic modifiers (A) Western-blots for SUV39H1 and H3. (B) Single plan images of the 3 cell types immunolabelled with antibody against SUV39H1 (scale bars represent 5 µm). A representative enlarged nuclei (white squares, lower panel, DNA in red and SUV39H1 in green) and the percentage of cells in the population displaying DAPI clusters enriched with SUV39H1 (white arrows) are indicated for each cell type. (C) Western-blots for PRC2 enzymes, EZH2 and EZH1, and H3 or Actin. (D) Single plan images of the 3 cell types immunolabelled with antibody against EZH2 (scale bars represent 5 µm).

