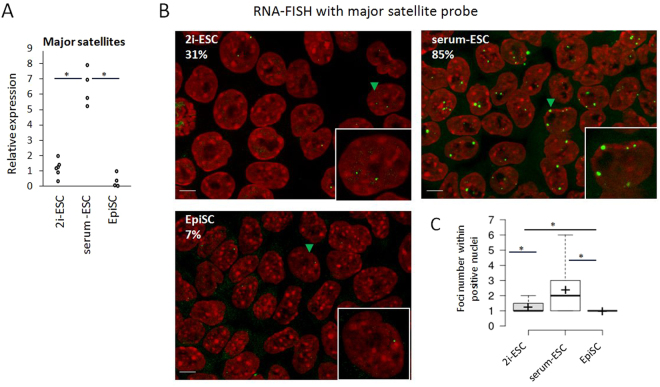
Figure 4.
Transcription of major satellites (A) Relative expression (CNRQ) of major satellite transcripts by qRT-PCR analysis normalized to Sdha and Pbgd housekeeping genes. Each point is an independent biological replicate. Statistically significant data are indicated by an asterisk (P < 5%, Mann-Whitney U test). (B) Detection of major satellite transcripts using RNA-FISH. Transcripts localization appears as green foci while DNA is counterstained with DAPI (red). Percentage of positive nuclei is indicated for each cell type as well as an enlarged representative nucleus (indicated in the cell field by a green arrowhead). Scale bars represent 5 µm. (C) Boxplots showing the number of foci/ positive nucleus. Mean is indicated by a cross. Statistically significant data are indicated by an asterisk (P < 0.3%, Student test).

