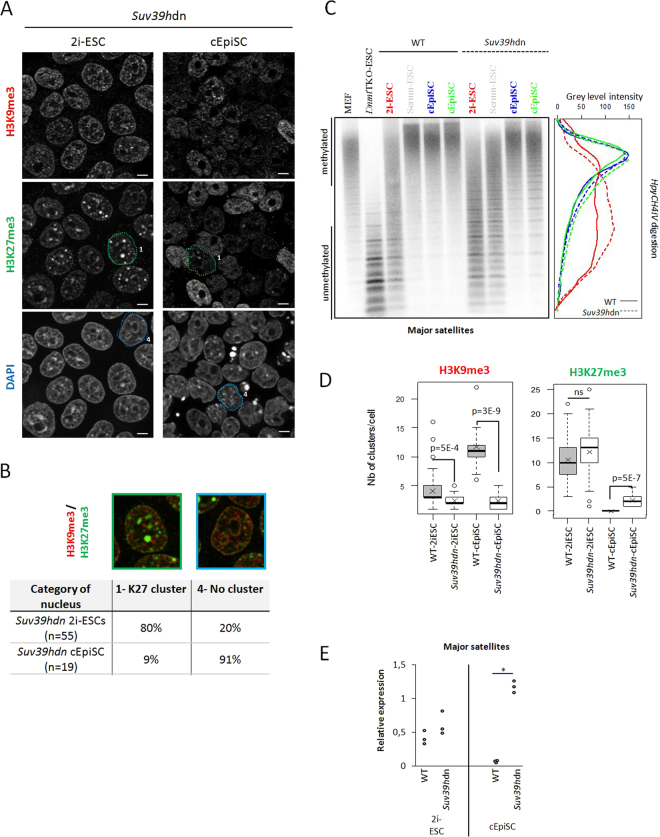
Figure 6.
Organization at PCH and major satellite transcript level in Suv39hdn cells. (A) Immunostaining images (single-plan) for H3K9me3 and H3K27me3 with DAPI DNA counterstaining in Suv39hdn condition, to compare with wild-type condition (Supplementary Fig. 2D). Encircled nuclei are representative examples of category 1 and 4. Scale bars represent 5µm. (B) Representative nuclei of the two categories as defined in Fig. 1B and percentages of each in the suv39hdn 2i-ESC and cEpiSC populations. (C) Southern-blot analysis of gDNA digested with HpyCH4IV revealed with probe for major satellites in wild-type and Suv39hdn conditions. Linescan quantification for 2i-ESC (red) and EpiSC (blue and green). Wild-type condition is represented with a continuous line, while Suv39hdn with a dotted line. (D) Box-plots showing the number of clusters of H3K9me3 or H3K27me3 in positive cells in WT and mutant ESC and cEpiSC. Pvalues (student tests) are shown. (E) Relative expression (CNRQ) of major satellites transcripts by qRT-PCR analysis normalized to Sdha and Pbgd housekeeping genes in wild-type and Suv39hdn condition. Each point is an independent biological replicate. Statistically significant data are indicated by an asterisk (P < 5%, Mann-Whitney U test).

