Fig. 4.
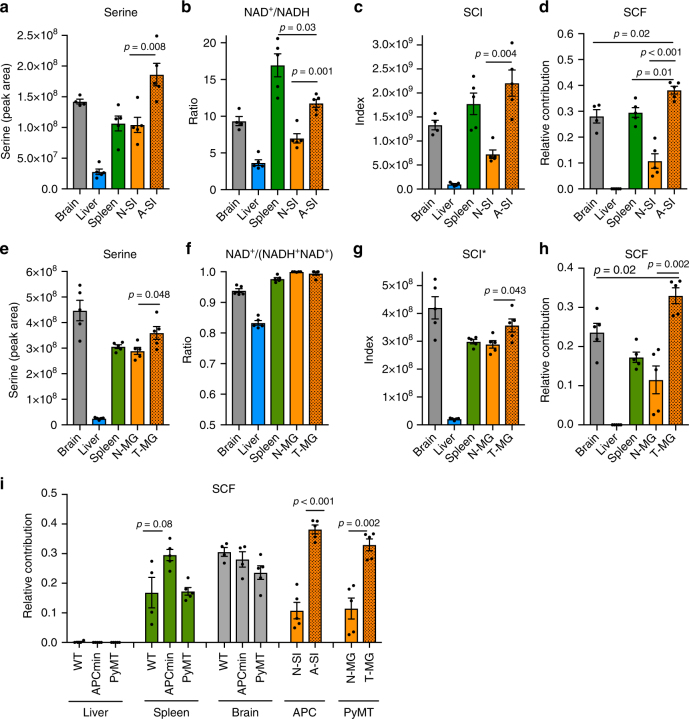
Increased serine catabolism to formate in APCMin/+ adenomas and PyMT tumors. a–d Metabolic analysis of APCMin/+ mice with clinical manifestation of the disease. a Serine levels, b NAD+/NADH ratio c SCI and d SCF in brain, liver, spleen, normal small intestine (N-SI), and in small intestine adenomas (A-SI) 24 h after 13C–MeOH injection. e–h Metabolic analysis in PyMT tumor-bearing mice (as in a–d). Except for f: here the NAD+/(NADH + NAD+) ratio was assessed due to technical reasons. g *Accordingly, in this case the SCI was calculated by serine × NAD+/(NADH + NAD+). MG mammary gland, T tumor, N normal. i Comparison of SCF in liver, spleen and brain in WT, APCMin/+, and PyMT mice and SI and MG tissues. Results were obtained from at least three mice. Error bars denote s.e.m. p-values are calculated using an unpaired t-test with Welch’s correction

