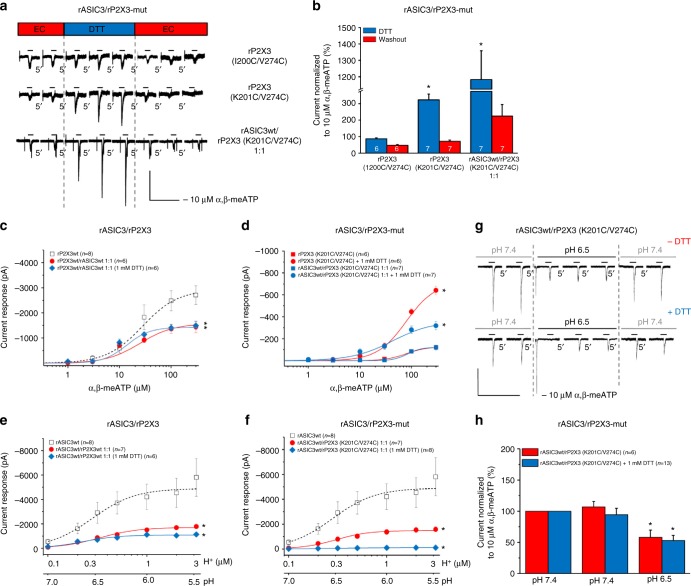
Fig. 6.
Effects of gate-inhibitory mutations in rP2X3Rs on rASIC3/rP2X3R function. Whole-cell patch-clamp recordings at a holding potential of −65 mV. a, b Analysis of rP2X3 double cysteine mutants with disulfide trapping. CHO cells were transfected with the cysteine mutants rP2X3 (I200C/V274C), rP2X3 (K201C/V274C) or co-transfected with rASIC3wt and rP2X3 (K201C/V274C) in a 1:1 ratio. a Current traces induced by α,β-meATP (10 µM) applied repeatedly for 2 s with 5 min intervals before, during and after the co-application of ditiothreitol (DTT; 1 mM). b Percentage changes of α,β-meATP-induced current responses were calculated with respect to the mean of the second and third currents during DTT application. Means ± S.E.M. of the indicated number of experiments. *P < 0.05; statistically significant difference between the current amplitudes during and after DTT application (Student’s t-test). c–f Concentration–response curves for protons and α,β-meATP in CHO cells co-transfected with the indicated receptors. c Effect of α,β-meATP (0.3–300 µM) on rP2X3Rwt, and rASIC3wt/rP2X3Rwt in the absence or presence of DTT. d Effect of α,β-meATP on rP2X3R (K201C/V274C) and rASIC3/rP2X3R (K201C/V274C) in the absence or presence of DTT. e Effect of protons (pH 7.0–5.5) on rASIC3wt and rASIC3wt/rP2X3Rwt in the absence or presence of DTT. f Effect of protons (pH 7.0–5.5) on rASIC3wt and rASIC3wt/rP2X3R (K201C/V274C) in the absence or presence of DTT. Means ± S.E.M. of the indicated number of experiments. *P < 0.05; statistically significant difference of the Imean values at the highest agonist concentration from the rP2X3Rwt and rASIC3wt curves, respectively (one-way ANOVA followed by the Holm–Sidak test). g Interaction between rASIC3wt and rP2X3R (K201C/V274C) in the absence and presence of DTT. Currents were elicited by α,β-meATP (10 µM) for 2 s with 5 min intervals before, during and after the pH shift from 7.4 to 6.5. h Percentage changes of α,β-meATP-induced current responses were calculated with respect to the second current before the pH shift. Means ± S.E.M. of the indicated number of experiments. *P < 0.05; statistically significant difference between the current amplitudes before and after the pH shift from 7.4 to 6.5 (Student’s t-test). The scale labels for the vertical bars were 200 pA (a, g). The scale labels for the horizontal bars were 20 s (a) and 50 s (g)

