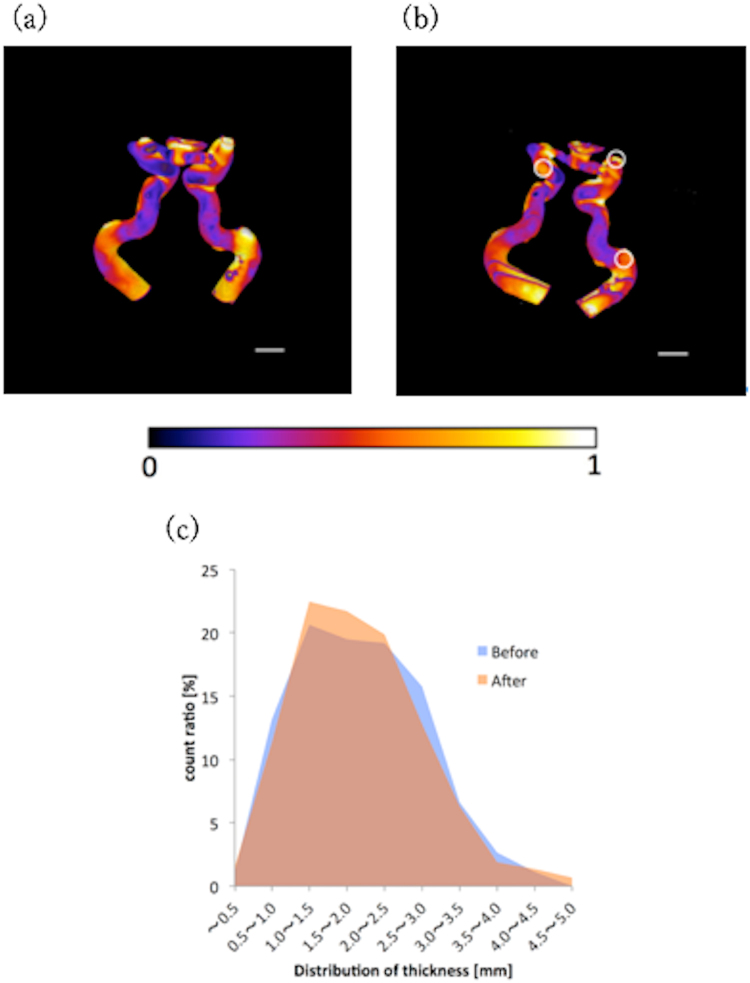
Figure 6.
3D reconstruction of the geometry of the blood vessel models with color contours indicating the thicknesses of the models. The thicknesses before and after the reformation processes were analyzed based on the reconstruction data; the data is based on the micro-CT acquired images (a) before drying and (b) after water immersion. The color contour represents the distribution of the thickness (1 indicates the thickest part (approximately 4.5 mm) in the model), and the white bar in the lower-right-hand-side of the image represents a thickness of 10 mm. (c) Histogram of the thicknesses of the blood vessel models both before and after completing the reformation processes.

