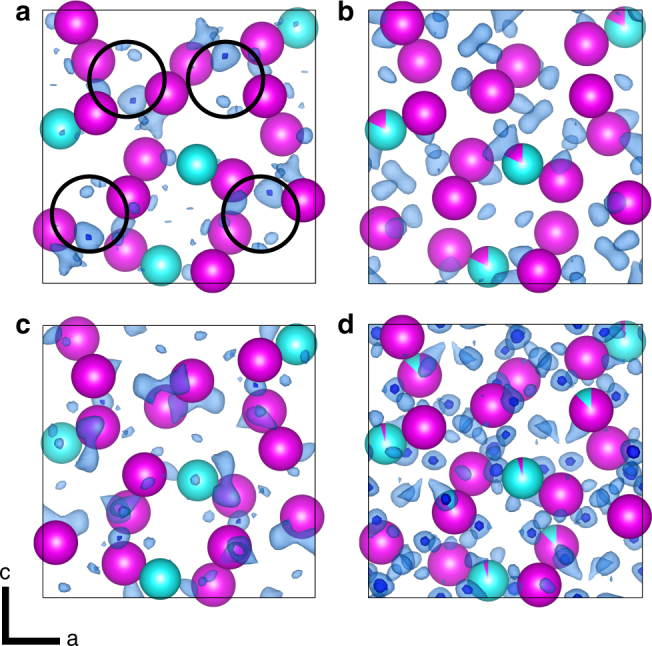
Fig. 3.

Results of ab initio silicide phase refinements plotted using VESTA V3.443. Fe, Cr and Ni atomic sites are interchangeable and shown in magenta. Si atomic sites are shown in turquoise. Residual Coulomb potential maps (ΔV) of the RR2450 π-ferrosilicide phase and carbon-deficient π-ferrosilicide phase solved in the P213 space group setting using the output of the refinements from JANA200622 are shown. Transparent light-blue residuals are plotted using a 2σ(ΔV) threshold (σ is the standard deviation of map values) and opaque dark-blue residuals are plotted using a 3σ(ΔV) threshold. Maps shown are of: a π-ferrosilicide after kinematical refinement, σ(ΔV) = 1.09 e/Å. Regions initially believed to correspond to a 25% carbon occupancy are circled; b π-ferrosilicide after dynamical refinement, σ(ΔV) = 0.093 e/Å; c carbon-deficient π-ferrosilicide after kinematical refinement, σ(ΔV) = 1.41 e/Å, and; d carbon-deficient π-ferrosilicide after dynamical refinement, σ(ΔV) = 0.054 e/Å. Note that the noise levels in the dynamical difference potential maps, quantified by the values of σ(ΔV), are more than ten times lower than in the kinematical difference potential maps
