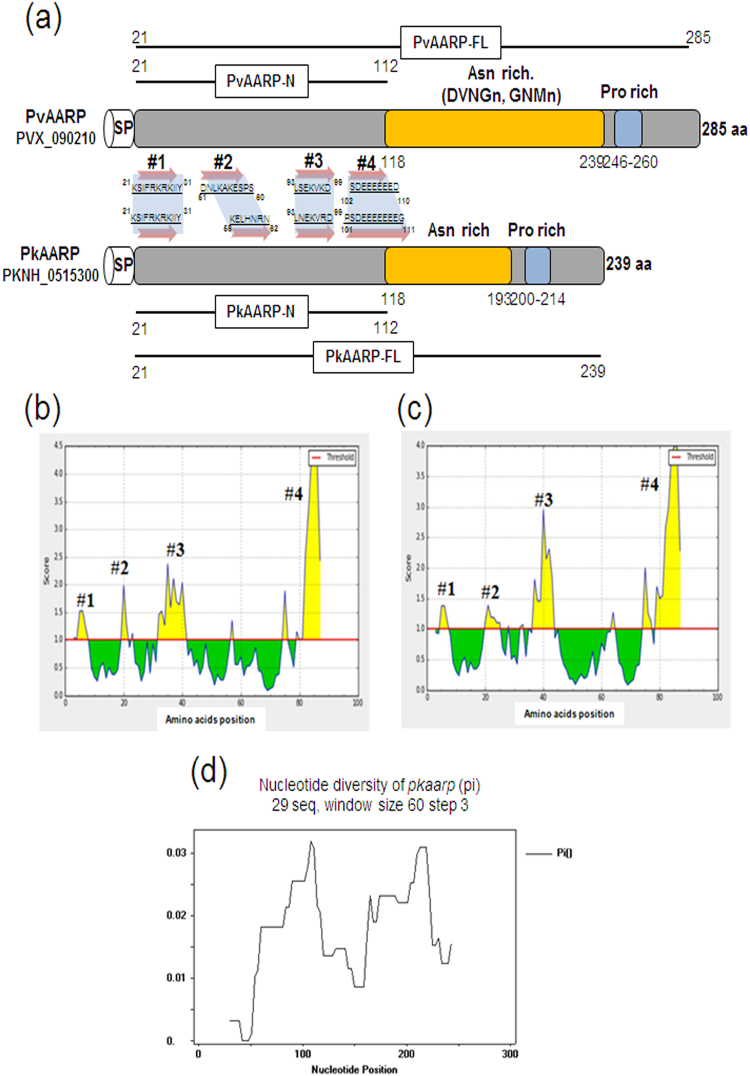
Figure 1.
Schematic structure, B-cell epitope prediction and sequence diversity of PvAARP and PkAARP. (a) Schematic structures of PvAARP (285 amino acids [aa]) and PkAARP (239 aa). Asparagine (Asn)- and proline (Pro)-rich regions are indicated in yellow and blue, respectively. Regions used to generate PvAARP N-terminus (rPvAARP-N, aa 21−112), PkAARP N-terminus (rPkAARP-N, aa 21−112) and full-length PvAARP (rPvAARP-FL) and PkAARP (rPkAARP-FL) recombinant proteins are indicated under each structure. Four predicted B-cell epitopes (#1−#4) are highlighted with arrows and aa sequences. (b and c) SP, signal peptide. B-cell epitope prediction of PvAARP-N (b) and PkAARP-N (c). Yellow areas above the threshold (red line) were predicted to be part of the B-cell epitope, and green areas were unlikely to be a part of the B-cell epitope. (d) Sliding window plot of the nucleotide diversity of the pkaarp gene encoding the N-terminus using 29 pkaarp sequences with a window size of 60 and a step size of 3.

