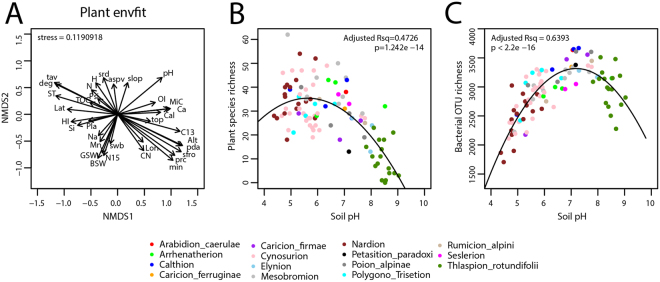
Figure 2.
Effect of abiotic factors on the plant and bacterial communities. (A) General effect of abiotic factors on the plant community structure, determined from the cover-abundance at each site and the environmental variables within NMDS ordination space using envfit(), and using previously published data30,36,40. Arrows indicate relative degree and directionality of effect. ST, soil temperature at depth −5 cm; pH, soil pH; C13, stable isotopic carbon ratio (mL−1 vs VPDB); N15, stable isotopic nitrogen ratio (mL−1 vs N2 in air); H, bulk hydrogen content (wt %); N, bulk nitrogen content (wt %); CN, C:N ratio; HI, hydrogen index (mg HC g−1 TOC); OI, oxygen index (mg CO2 g−1 TOC); TOC, total organic carbon content (wt %); MiC, mineral carbon content (wt %); BSW, bulk soil gravimetric water content (40°, %); GSW, sieved soil gravimetric water content (105 °C, %); Si, SiO2 (wt %); Mn, MnO content (wt %); Ca, CaO content (wt %); Na, Na2 content (wt %); PSi, phyllosilicates (%); Pla, plagioclase-Na (%); Cal, calcite (%); Lon, longitude (x, Swiss coordinate system); Lat, latitude (y); Alt, elevation (m); slop, terrain slope (°); aspv, sine transformed direction that a slope faces; top, topographic position; deg, annual degree days (day × deg); min, monthly moisture index (0.1 mm month−1); srd, daily average of global potential shortwave radiation per month (kJ day−1); tav, monthly average temperature (°C × 100); swb, annual average site water balance accounting for soil properaties (0.1 mm year−1); sfro, annual average number of frost days during the growing season (day × 100); pda, number of precipitation days per growing season (day); prc, monthly mean precipitation sum (mm). (B) Plant species richness and (C) bacterial OTU richness at each site plotted against soil pH. The dots are color-coded a posteriori according to the vegetation alliance to which the sites belong. Lines in panels B and C display quadratic trend-lines with their adjusted R2 (Rsq) and P-values.

