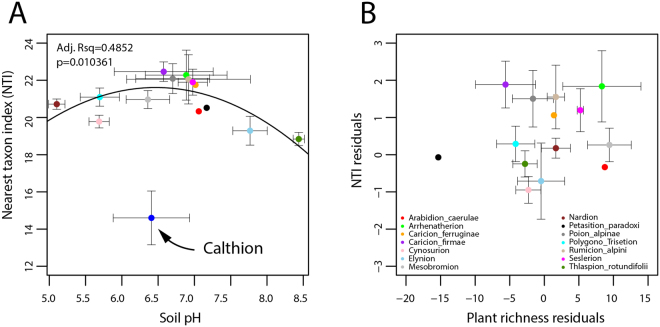
Figure 3.
Effect of the environment on the evolutionary history of mountain grassland soil bacterial communities. (A) Mean bacterial nearest taxon index (NTI) values across vegetation alliances versus soil pH. (B) Bacterial NTI residuals versus plant species richness residuals after removing the pH effect on both, and excluding the Calthion alliance outlier. Dots are color-coded by alliance, whereas error bars represent the standard error within each vegetation type. The line in panel A displays the quadratic trendline across all the mean NTI values, excluding the Calthion samples, with adjusted R2 (Adj. Rsq.) and P-value as indicated.

