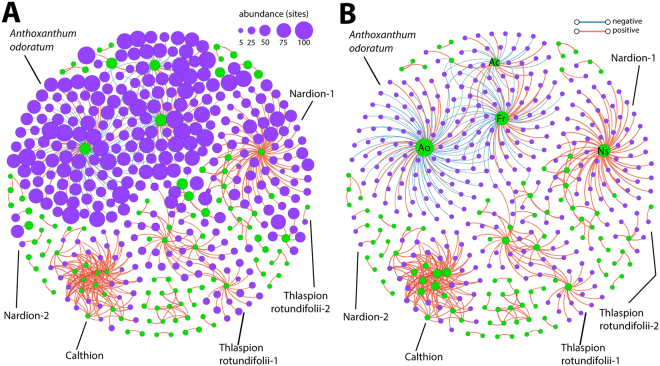
Figure 5.
Correlation network analysis of the interactions among plant species alone and with bacterial OTUs, with node sizes in (A) indicating the number of sites where the plant species or bacterial OTU occurs, and (B) the degree of connectivity (the number of edges). Plant species nodes in green, bacterial OTUs nodes in purple. Edges represent the FDR-corrected positive (red) or negative (blue) Spearman’s correlations between plant species and bacterial OTUs, or among plant species. Only interactions with Spearman correlations of ≥0.6 or ≤−0.6 are indicated. Striking recognizable clusters are named according to abundant plant names, or vegetation alliances. Ao, Anthoxanthum odoratum aggr., Fr, Festuca rubra aggr., Ac, Agrostis capillaris, and Ns, Nardus stricta. Lines point to the most important alliances and clusters mentioned in the main text.

