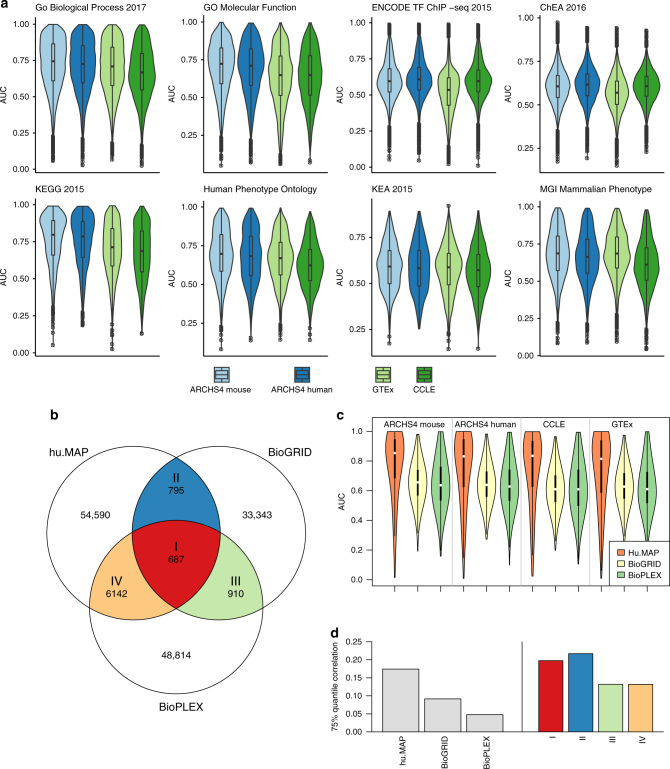
Fig. 6.
Prediction of biological function and protein–protein interactions. a The distribution of AUC for gene set membership prediction of gene annotations from eight gene set libraries with co-expression data created from ARCHS4 mouse, ARCHS4 human, GTEx, and CCLE. The gene set libraries used to train and evaluate the predictions are ChEA, ENCODE, GO Biological Process, GO Molecular Function, KEA, KEGG Pathways, Human Phenotype Ontology, and MGI Mammalian Phenotype Level 4. These libraries were obtained from the Enrichr collection of libraries. b Venn diagram showing the intersection of edges between three PPI databases hu.MAP, BioGRID, and BioPLEX. c Distribution of AUC for protein–protein interaction prediction from gene co-expression data created in the same way from ARCHS4 mouse, ARCHS4 human, CCLE, and GTEx. d Bar plot of the pairwise correlation between genes with reported protein–protein interactions for the three PPI networks hu.MAP, BioGRID, and BioPLEX in ARCHS4 mouse expression. The right tail of the gene pair correlation distribution is shown by the 75% quantile. On the right, the bars represent the percent overlap of predicted interactions for the matching intersections from the Venn diagram plotted in b

