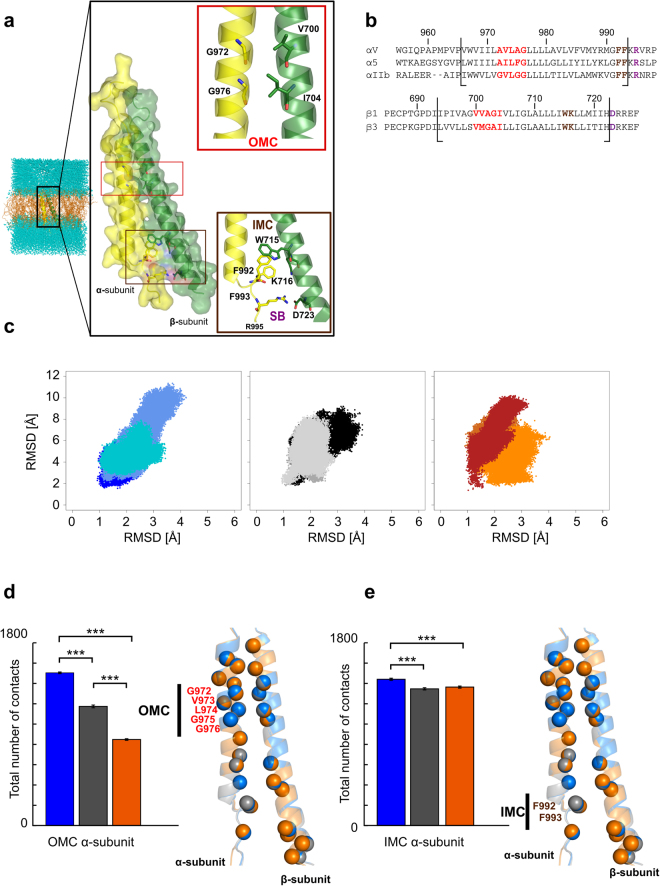
Figure 1.
Structural integrity of the membrane-embedded helices throughout the MD simulations and contacts across the interface. (a) Exemplary simulation box generated to perform MD simulations including the NMR structure of αIIbβ3 TMD (PDB ID 2K9J; cartoon and surface representation) with the position of the OMC (red box) and IMC (brown box) indicated; phospholipids are shown as orange sticks, and water layers as blue spheres. Close-up views of the box contents show essential residues mediating the clasps: αIIb-G972/G976 and β3-V700/I704 for the OMC, αIIb-F992/F993/R995 and β3-W715/K716/D723 for the IMC plus the putative salt bridge. (b) Sequence alignment of the αIIbβ3, αvβ3, α5β1 TMD sequences used to generate the homology models. GXXXG and GFFKR motifs are highlighted in red and brown, respectively, and R995/D723 residues in purple. Black bars indicate the TMD borders as reported in ref.45. (c) Two dimensional histograms of the RMSD values of all Cα atoms (ordinate values) and only those that are embedded in the membrane (abscissa values) (range of residues considered: P996-V1015 and D718-I747) calculated over three MD simulations. Blue, cornflowerblue, turquoiseblue colored dots represent αIIbβ3 (MD simulations 1, 2 and 3); darkgrey, black, lightgrey αvβ3; chocolate, orange, firebrick α5β1. (d,e) Histograms of the total number of overall contacts per residue at the OMC and IMC averaged over three MD simulations, with error bars showing the standard error of the mean (SEM; eq. 6) and stars indicating the statistical significance (see Methods section for definition). Here, only residues of the α subunit are shown (numbering refers to the αIIb subunit). On the right of the plots, a superimposition of the αIIbβ3, αvβ3, and α5β1 TMDs in blue, grey, and orange, respectively, is shown. The Cα atoms of residues considered in the contact analysis are indicated as spheres, and the residues of the α subunit considered in the analyses are labeled.

