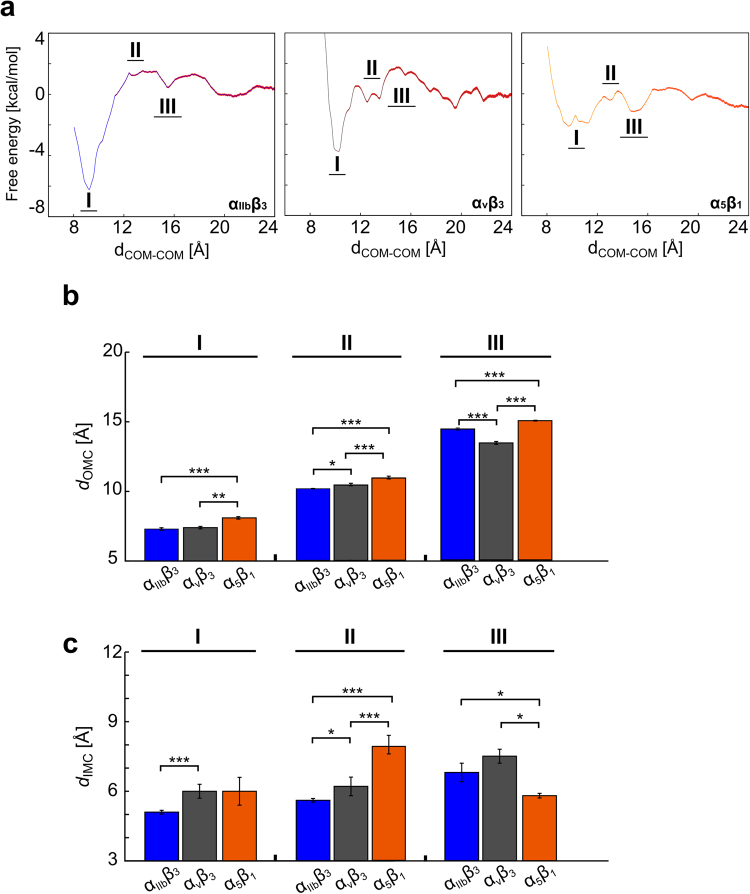
Figure 3.
Potential of mean force of TM helix association of αIIbβ3, αvβ3, and α5β1 TMDs and differences at the OMC/IMC interface with increasing dCOM-COM. (a) Configurational free energies as a function of the dCOM-COM used as a reaction coordinate for αIIbβ3 (left panel), αvβ3 (middle panel), and α5β1 (right panel) TMDs. Roman numbers indicate free energy minima. Statistical errors, calculated using bootstrap analysis, are displayed as red shaded curves added to the PMF profiles. The PMF values at dCOM-COM = 20 Å were set to zero. (b,c) Histograms of the averaged dOMC (B) and dIMC (C) across umbrella sampling windows linked to free energy minima I–III observed in panel (A) (see also Table S7), using reweighted (“unbiased”) TMD configurations. Error bars denote the SEM (eq. 5) and stars indicate the statistical difference (see Methods section for definition).

