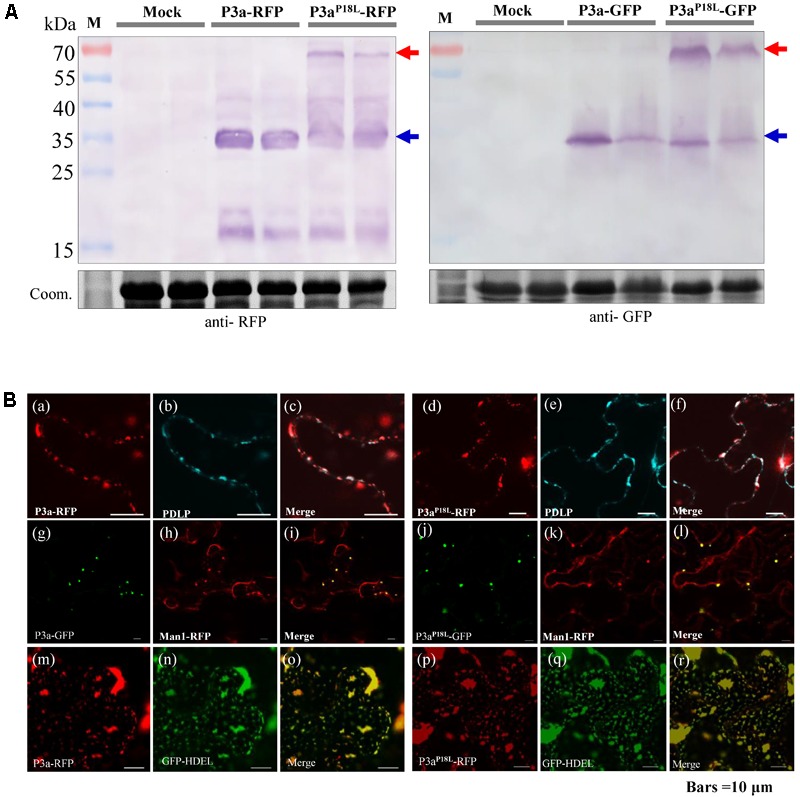
FIGURE 5.

Subcellular localization of P3a in N. benthamiana leaves. (A) Western blot analysis of P3a-GFP and P3a-RFP in N. benthamiana agro-infiltrated leaves. The immunoblots were incubated with antiserum specific to RFP or GFP. Coomassie brilliant blue (Coom.) staining is shown as a loading control. Red and blue arrow marks show that the fusion proteins migrated in their dimeric and monomeric forms, respectively. (B) a–f, co-expression of BrYV P3a-RFP or P3aP18L-RFP with CFP-PDLP in N. benthamiana epidermal tissue. CFP-PDLP was used as a plasmodesmata marker (Li et al., 2017). The CFP (cerulenin fluorescence protein) fluorescence signal is shown as cyan and the RFP fluorescence signal as red. g–l, co-expression of BrYV P3a-GFP or P3aP18L-GFP with mCherry-based Golgi marker which was used to show Golgi apparatus (Nelson et al., 2007). m–r, expression of BrYV P3a-RFP in 16c GFP-HDEL transgenic plants. Experiments were repeated three times and monitored 36 and 48 hpi with similar results. Bars = 10 μm.
