Figure 3.
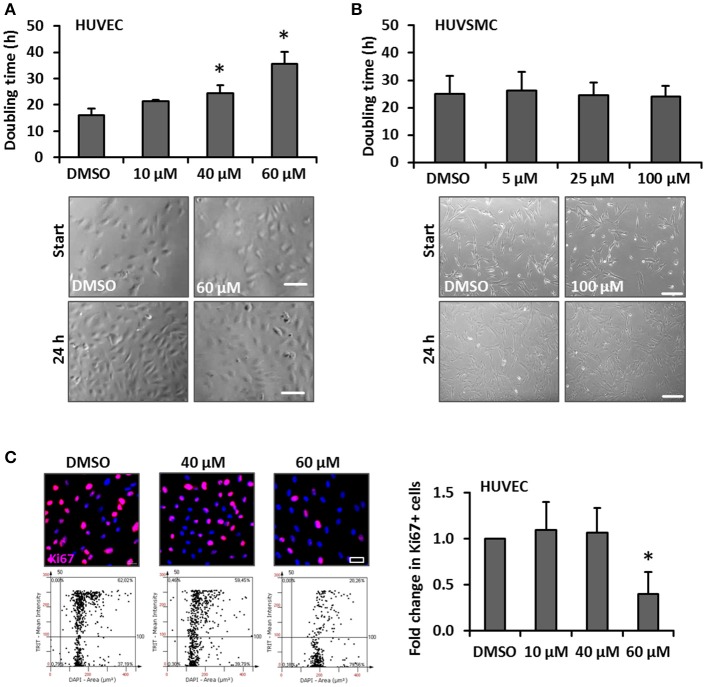
Impact of GA on HUVEC and HUVSMC proliferation. Proliferation of HUVECs (A) and HUVSMCs (B) was carried out by counting the number of cells within 5 defined MFV per experimental group and calculated as time (h) needed to double the cell population. Cells were treated with the indicated concentrations of GA or an equivalent volume of DMSO vehicle control (A, *p < 0.05 vs. DMSO, n = 3; B, p > 0.05 for all comparisons, n = 4). Representative phase contrast images showing the original cell density (start) and after 24 h (A, scale bar: 100 μm; B, scale bar: 200 μm). Fold change of Ki67-positive (Ki67+) HUVECs treated with DMSO or the indicated concentrations of GA was obtained using the automated immunofluorescence analysis (representative images are shown in C, scale bar: 20 μm), demonstrated in the corresponding scattergrams (C, lower panel of representative images) and calculated as fold change of Ki67+ HUVECs [*p < 0.05 vs. DMSO (set to 1), n = 4].

