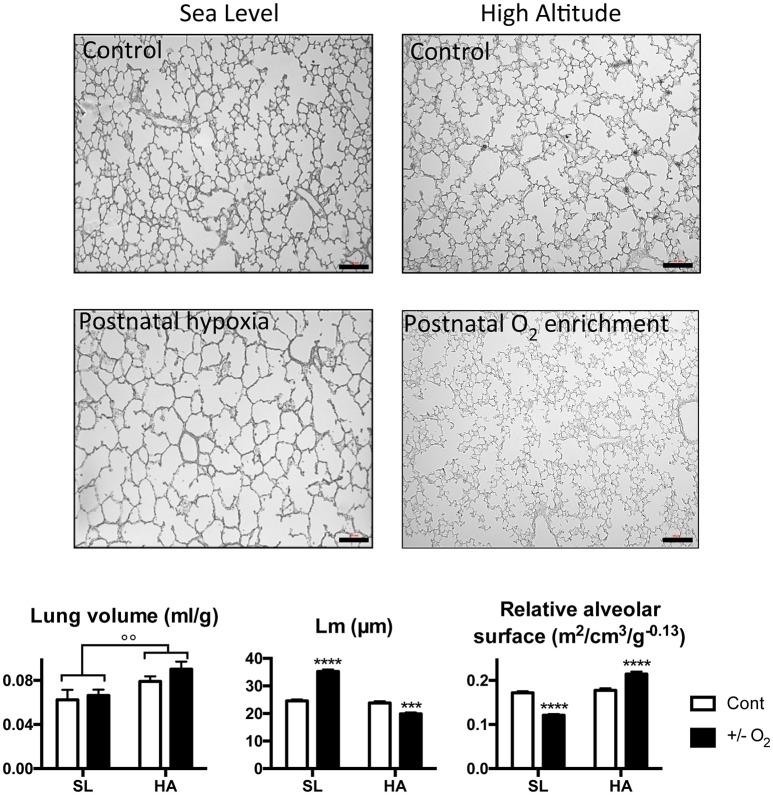
Figure 4.
Representative microphotographs showing lung and alveolar structures in young (postnatal day 15) rats living at sea level (SL—Quebec-city, Canada), and at high altitude (HA—La Paz, Bolivia, 3,600 m), following exposure to ambient O2 level (control), hypoxia (at SL−13.5% O2), or O2 enrichment (at HA−32% O2) between postnatal days 4–14. Lower panels show lung volume, mean linear intercept (Lm), and relative alveolar surface in control (Cont) rats and in rats exposed to hypoxia (at SL), or normoxia (at HA). All values are mean + s.e.m. Number of animals in each group: SL control and hypoxic rats n = 9 and 12, HA control and O2 enriched rats n = 8 and 8. Scale bars: 50 μm. ***P < 0.001, and ****P < 0.0001 ± O2 vs. Cont. ◦◦P < 0.01 HA vs. SL.

