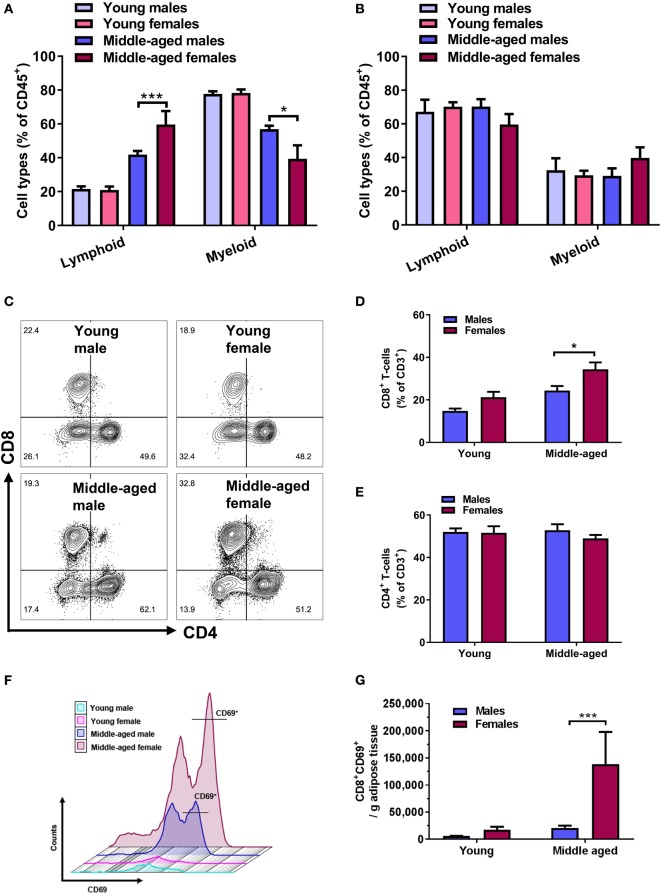
Figure 2.
Age-associated increases in adipose lymphoid cells and CD8+ T cells are pronounced in females. Flow cytometry quantification of lymphoid (CD45+CD11b−) and myeloid cell (CD45+CD11b+) percentages of (A) adipose tissue and (B) blood-derived immune cells. Two-way ANOVA lymphoid cells: effect of age p < 0.001, effect of sex p < 0.01; myeloid cells: effect of age p < 0.001, *p < 0.05, ***p < 0.001 Sidak’s multiple comparison’s test, n = 5. (C) Representative contour plots of CD4+ and CD8+ T-cell populations, with outliers displayed, in adipose tissue of young and middle-aged male and female mice. (D) Quantification of CD8+ T-cell percentages (CD3+CD8+) and (E) CD4+ T cells (CD3+CD4+) in adipose tissue of young and middle-aged mice using flow cytometry. Two-way ANOVA effect of age: p < 0.001, sex: p < 0.01. *p < 0.05 Sidak’s multiple comparison’s test, n = 8–9. (F) Representative histograms of CD8+CD69+ T cells in adipose tissue from young and middle-aged male and female mice. (G) Absolute number of activated CD8+ T cells (CD8+CD69+) normalized to bead counts and adipose tissue weights. Two-way ANOVA effect of age: p < 0.05, sex: p < 0.05, ***p < 0.001 Sidak’s multiple comparison’s test, n = 5.

