
Figure 13.
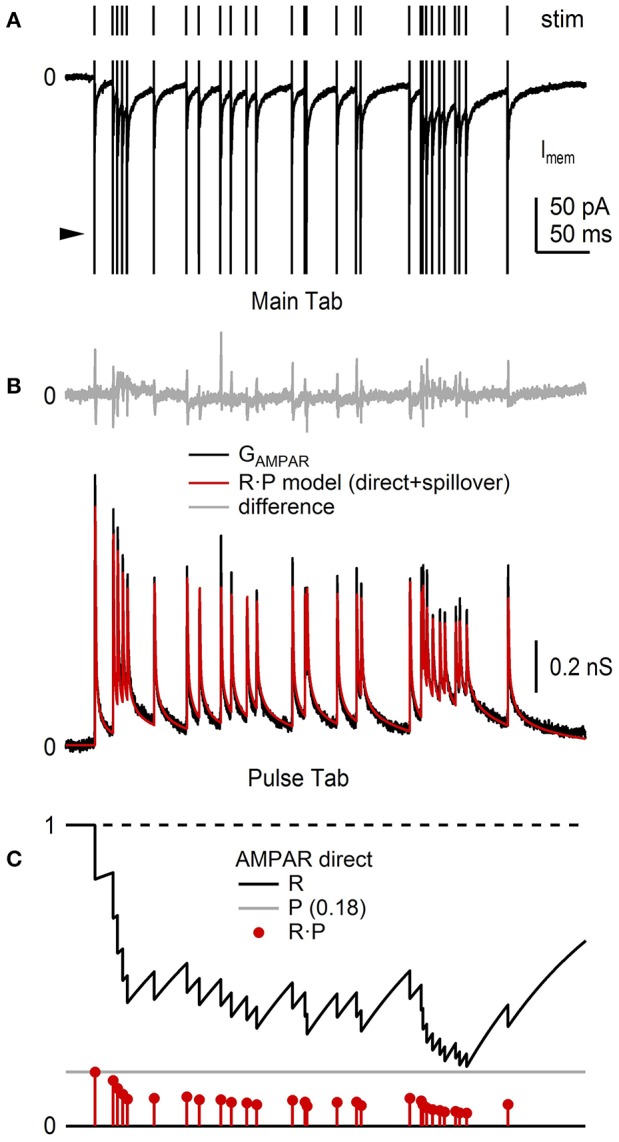
NeuroMatic analysis and simulation of synaptic short-term plasticity. Analysis of short-term depression of EPSCs recorded from the cell body of 4 GCs. Data was recorded in voltage-clamp mode via an Axopatch 200B amplifier and Axograph software (100 kHz sample rate). (A) Train of GC EPSCs containing an AMPAR and NMDAR component (bottom; control; average of 10 repetitions) evoked by stimulation of a single MF input at random Poisson intervals with mean rate of 85.6 Hz (top). The large fast currents before each EPSC are stimulus artifacts (arrowhead) which have been truncated for display purposes. The NMDAR component was isolated by taking subsequent recordings in 5 mM NBQX (not shown). (B) Average GAMPAR train (black) computed from EPSC trains, such as the one in (A), from 4 GCs, as described in the main text. Red trace is an R·P plasticity model computed via the Pulse tab (Figure 11) consisting of a direct and spillover component each having independent R and P dynamic variables. Top: difference between the data and model (gray). The brief transients (<1 ms) are due to small mismatches at the peak of the direct components. Model parameters were from Billings et al. (2014), with adjustments to the amplitude and Pinf values to simulate this particular GAMPAR train. (C) Plasticity model parameters R (black), P (gray) and R·P (red circles) of the direct component of the GAMPAR train in (B), where Rinf = 1, Pinf = 0.14, Δ = 0, τR = 131 ms. Parameters for the spillover component (not shown) were Rinf = 1, Pinf = 0.68, Δ = 0, τR = 14.85 ms. GC experimental details: cerebellar slices from P40 rats, Ra = 17–24 MΩ, Cmem = 2.4–6.0 pF, Vhold = −60 or −66.3 mV. Data is from Rothman et al. (2009).