
Figure 15.
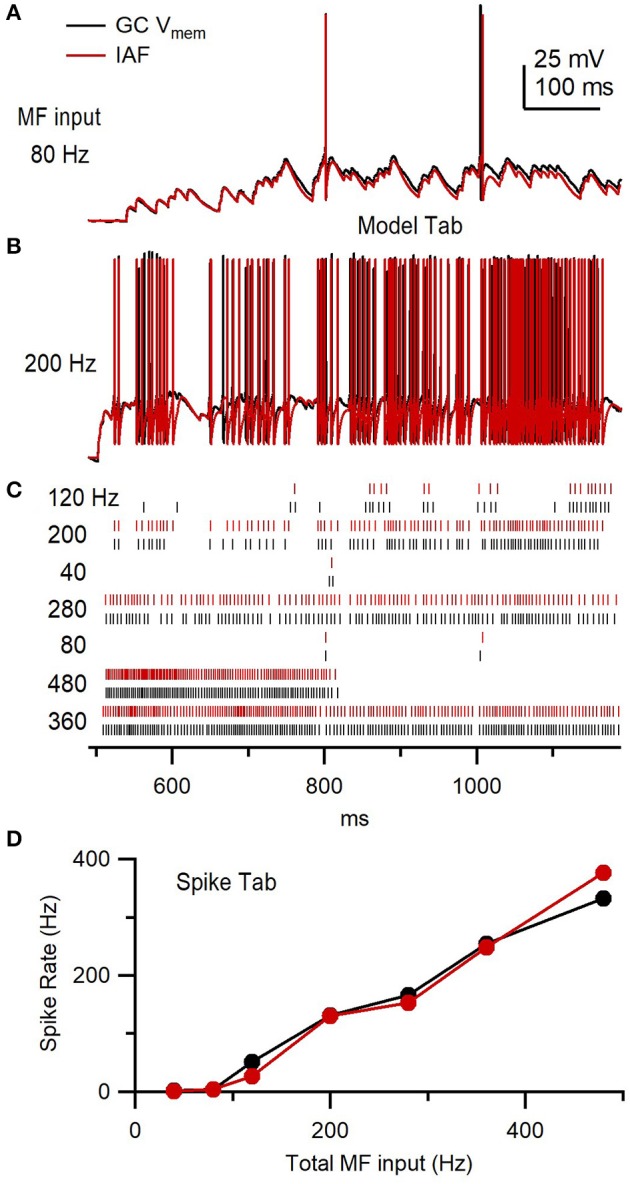
Granule cell versus integrate-and-fire model response to the same simulated synaptic conductance trains. (A) GC membrane potential (Vmem) from Figure 14C (black) compared to an IAF model response (red) to injection of the same GAMPAR and GNMDAR waveforms (80 Hz total MF input rate) and tonic GGABAR. The IAF response was computed using NeuroMatic's Model tab as described in Supplementary Figure 6. (B) Same as (A) but for GAMPAR and GNMDAR computed with 4 simulated MF inputs with f = 50 Hz (i.e., 200 Hz total MF input rate) via the Pulse tab. (C) Spike raster plots computed from Vmem responses in (A,B), and 5 other responses for different f, using the Spike tab. The total MF input rate is denoted on the left. (D) Output spike rate versus total MF input rate using data in (C).