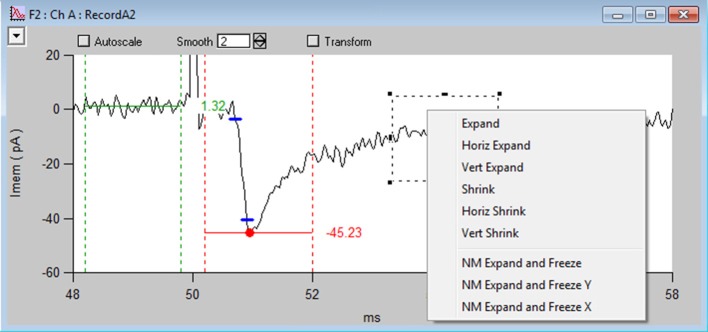
Figure 3.
NeuroMatic's channel graph. Screen capture of the channel A graph (Ch A) for the Stats-tab rise-time analysis displayed in Figure 2, showing a voltage-clamp recording (RecordA2, black line) acquired from the cell body of a granule cell (GC) in a cerebellar slice, where extracellular stimulation of a single mossy-fiber (MF) synaptic input at 50 ms (see stimulus artifact, which has been clipped for display purposes) evoked an EPSC (inward current). Red circle and horizontal line denote the minimum of the EPSC computed within the dashed vertical red lines (xbgn, xend). An average baseline value (horizontal green line) has been computed before the EPSC within the dashed vertical green lines. Blue dashes denote where the EPSC reaches 10 and 90% of the peak amplitude from baseline. The time between these points is the 10–90% rise time (0.20 ms). Data was filtered by a binomial smooth function (2 smoothing operations). Note, each channel graph has options to apply temporary transforms to the data (top) such as filter, baseline, normalize and differentiate. Various display options are listed within the top-left popup control, such as overlay, grid lines and axis scaling. More options are listed by clicking inside an Igor marquee (dashed square), created by clicking and dragging the mouse diagonally to frame a region of interest. Data was acquired via the Clamp tab from a cerebellar slice from a P24 mouse, where access resistance (Ra) = 14 MΩ, membrane capacitance (Cmem) = 2.5 pF and the holding potential (Vhold) = −76.3 mV.

