
FIGURE 2.
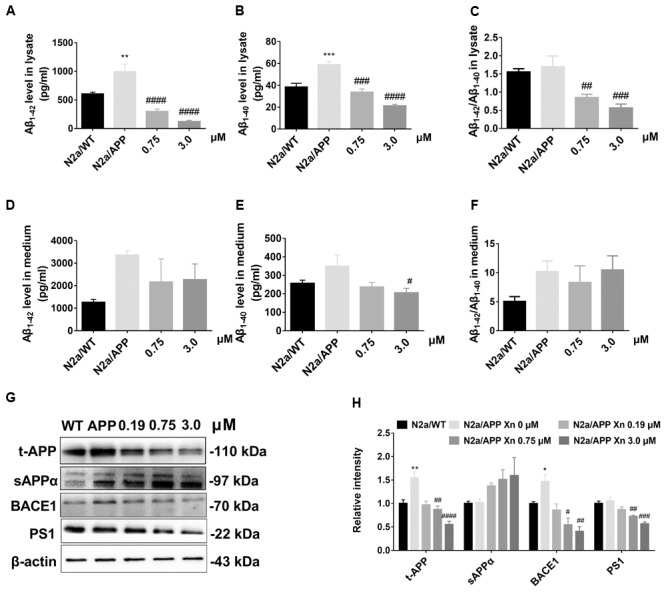
Xn inhibited Aβ accumulation and APP processing. Levels of Aβ1-42 (A,D), Aβ1-40 (B,E), and Aβ1-42/Aβ1-40 (C,F) of cell lysate (A–C) and cell culture media (D–F) as a function of Xn concentration were determined by ELISA. Ratios of Aβ1-42/Aβ1-40 are shown on the right (C,F). Levels of t-APP, s-APPα, BACE1, and PS1 were determined by Western-blot analysis (G,H). β-Actin was used as a loading control. N = 5 for (A–C); N = 4 for t-APP and BACE1 (G); N = 3 for the rest. ∗p < 0.05, ∗∗p < 0.01 compared with N2a/WT cells. #p < 0.05, ##p < 0.01, ###p < 0.001, ####p < 0.0001 compared with untreated N2a/APP cells.