
FIGURE 3.
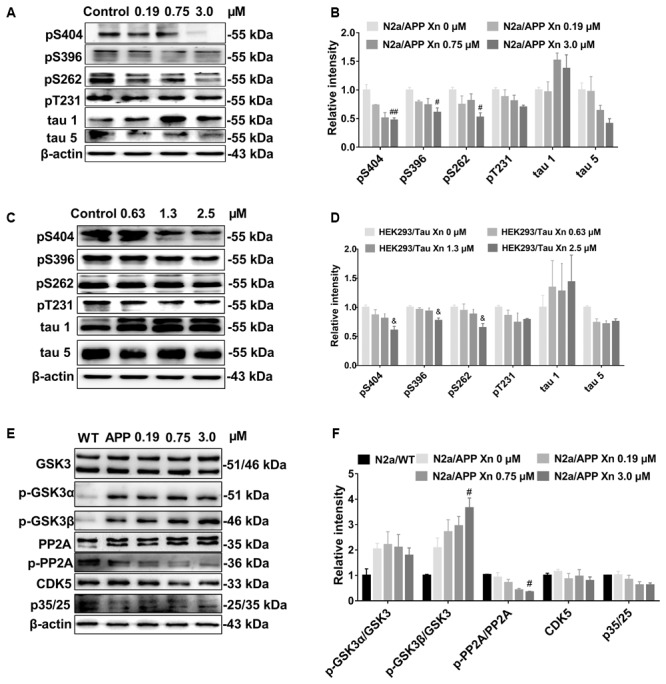
Xn attenuated tau phosphorylation in both N2a/APP cells and HEK293/Tau cells. Shown are the levels of phosphorylated tau and total tau in N2a/APP cells (A,B), the levels of phosphorylated tau and total tau in HEK293/Tau cells; (C,D). The phosphorylation of upstream pathways of tau in N2a/WT and N2a/APP cells (E,F) were determined by Western-blot analysis. β-Actin was used as a loading control. N = 3. #p < 0.05 and ##p < 0.01 compared to untreated N2a/APP cells, &p < 0.05 compared to untreated HEK293/tau cells.