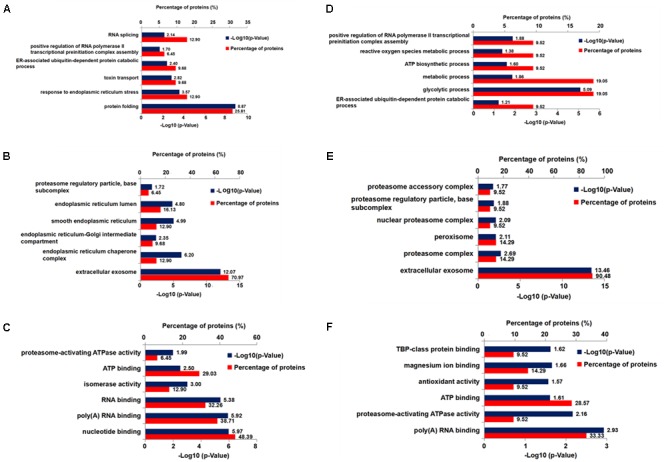
FIGURE 5.

Six bioinformatics analyses of differentially expressed proteins from Xn-treated and-untreated N2a/APP cells. Shown are (A) the biological process, (C) the molecular function, and (B) the cellular component enrichment in Gene Ontology terms of the differentially expressed proteins in N2a/APP cells (when compared with N2a/WT cells); (D) the biological process, (F) the molecular function, and (E) the cellular component enrichment of the differentially expressed proteins in Xn-treated N2a/APP cells (when compared with untreated N2a/APP cells).
