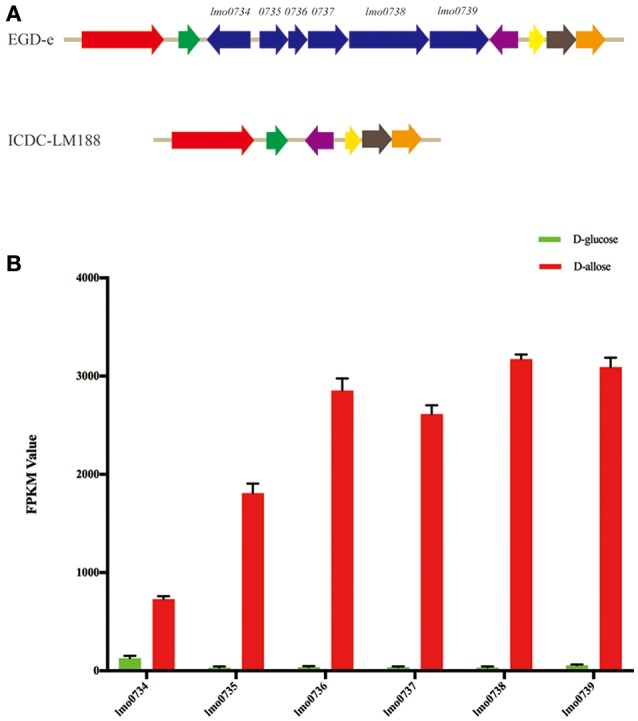
Figure 3.

Genome analysis and gene expression levels. (A) The cluster of whole-genome alignment between L. monocytogenes EGD-e and ICDC-LM188. The same color angled arrows represent the same genes. Six genes of EGD-e were found to be absent in ICDC-LM188 (between the green and purple angled arrows). (B) Comparison of the expression level comparisons of five different genes between D-glucose and D-allose (P < 0.001). FPKM, fragments per kilobase of transcript per million mapped reads.
