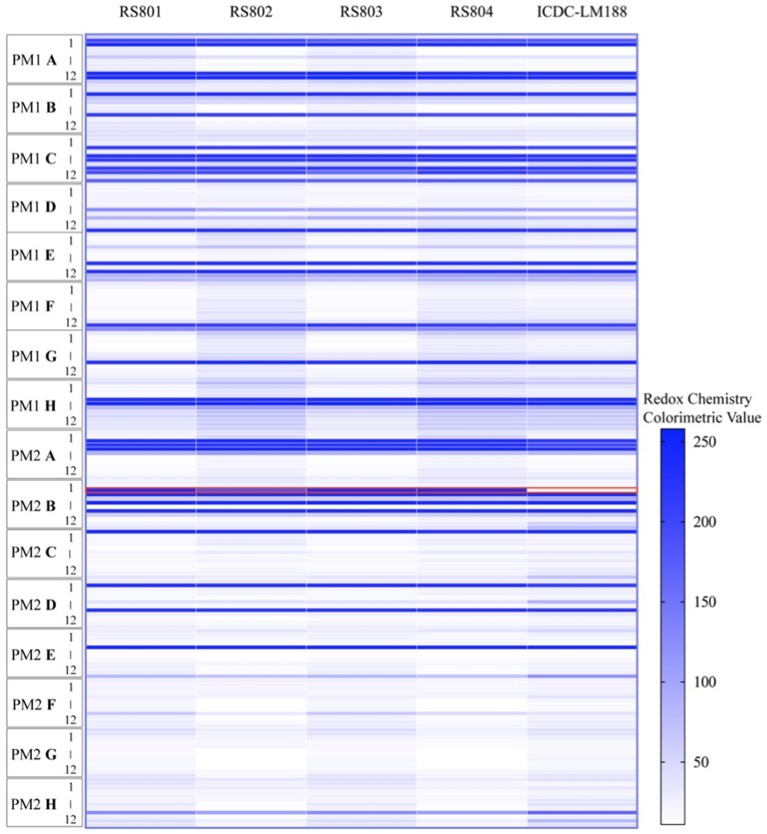
Figure 5.
Phenotype microarray analysis of the utilization of carbohydrate by ICDC-LM188, RS801, RS802, RS803, and RS804. All plates were incubated at 37°C for 24 h. PM represent a PM plate, A–H and 1–12, respectively, represent the column and row of the PM plate. Each horizontal line in the heat map shows a type of carbohydrate metabolism. The red border marking the line represents the utilization of D-allose.

