
FIGURE 2.
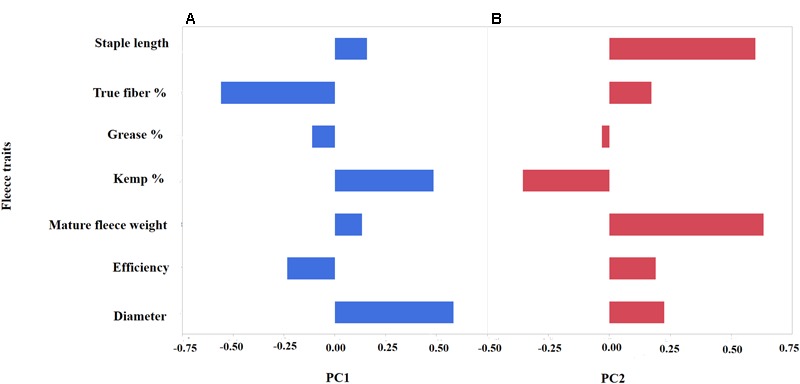
Principal Component Analysis (PCA) depicting the loading values (x-axis) of seven mohair traits (y-axis) for PC1 (A) and PC2 (B). PC1 (blue) broadly describes “mohair quality” as indicated by the positive correlation between diameter and kemp percentage, while having negative correlation to true fiber percentage. PC2 (red) reflects fleece volume with a positive correlation between increased staple length and fleece weight.