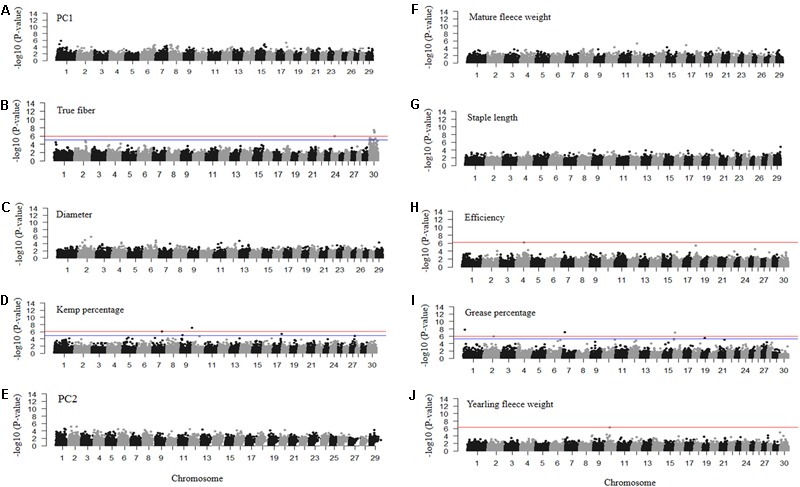
FIGURE 6.

Manhattan plots of –log10 (P-values) for association of SNP loci for mohair traits (A) PC1 reflecting fiber quality, (B) true fiber percentage, (C) fiber diameter, (D) kemp percentage, (E) PC2 reflecting fiber volume, (F) mature fleece weight, (G) staple length, (H) efficiency, (I) grease percentage, and (J) yearling fleece weight. Traits with red and blue horizontal lines indicate Bonferroni and FDR corrected P-values of 0.05, respectively. Those with only a red horizontal line indicate P-values thresholds were the same for both Bonferroni and FDR. Those without horizontal lines reflect GWAS run using permutation testing.
