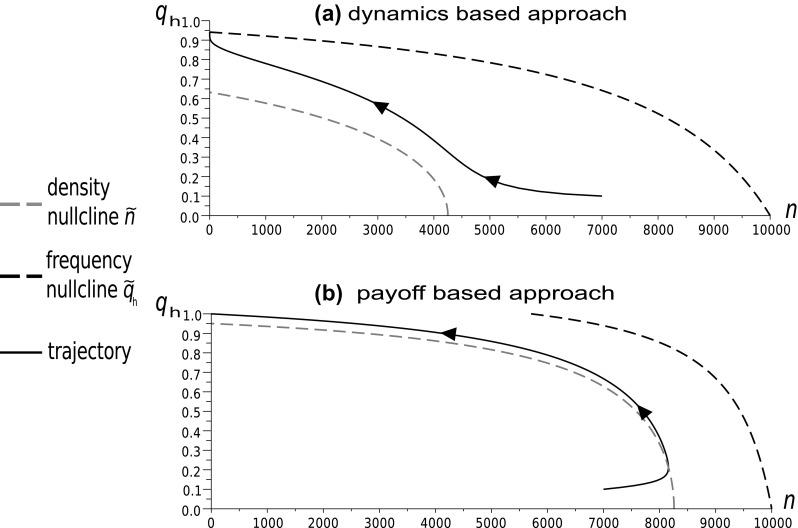
Fig. 7.

Phase diagrams following the evolution of the Hawk frequency and population size for the payoff-based and dynamics-based models for the parameters: , , . The frequency and density nullclines occupy different positions with respect to the same initial point in both cases, and the trajectories obtained are totally different
