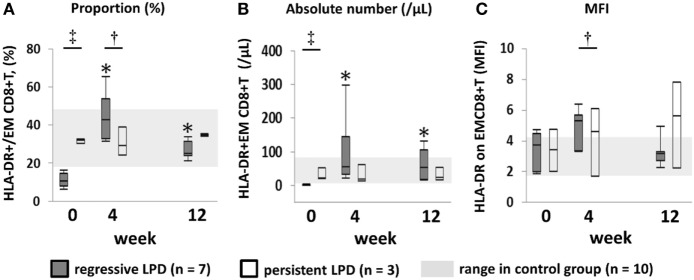
Figure 6.
Transition of proportion and absolute number of activated EMCD8+ T cell, mean fluorescence intensity (MFI) of HLA-DR on EMCD8+ T cell after methotrexate (MTX) cessation. Transition of (A) proportion and (B) absolute number of activated EMCD8+T cell, (C) MFI of HLA-DR onEMCD8+ T cell after MTX cessation. Comparison between the three groups was conducted by Kruskal–Wallis test, and comparison between two groups was conducted by Wilcoxon test. †Regressive vs. Control, P < 0.05. ‡Regressive vs. Control, P < 0.05; Regressive vs. Persistent, P < 0.05. *P < 0.05 for the comparison with the value at week 0 in each group. EM, effector memory.

