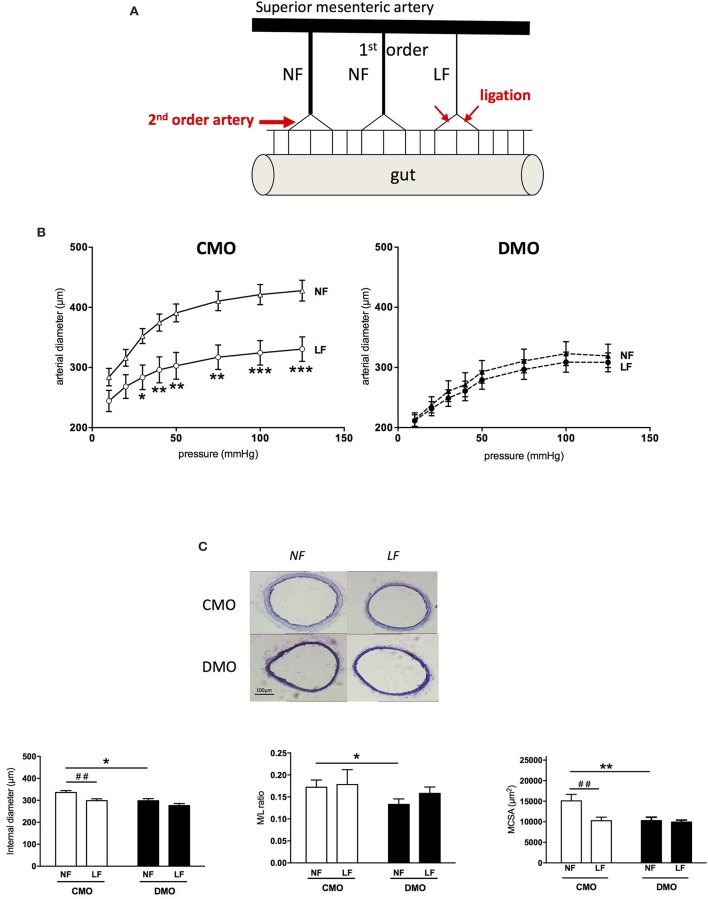
Figure 3.
Impact of decreased-flow on mesenteric resistance arteries in 3-month old control (CMO) and diabetic (DMO) mother offspring. (A) Schematic representation of the model used to locally change blood flow in mesenteric arteries after ligation. (B) Low flow (LF) and normal flow (NF) arteries diameters of CMO and DMO 1 week post-ligation in response to stepwise increase pressure (n = 7), *p < 0.05, **p < 0.01, and ***p < 0.001 LF vs. NF. (C) Examples of light microscopy images of LF and NF mesenteric arteries of CMO and DMO rats, magnification X10 with associated morphometric measurements of internal diameter, media to lumen ratio (M/L ratio) and cross-sectional area of the media (MCSA) of normal flow (NF) and low flow (LF) arteries in CMO (open bars, n = 12) and DMO (solid bars, n = 9) rats; each bar graph represents mean ± SEM. *p < 0.05, DMO vs. CMO, ##p < 0.01 LF vs. NF.

