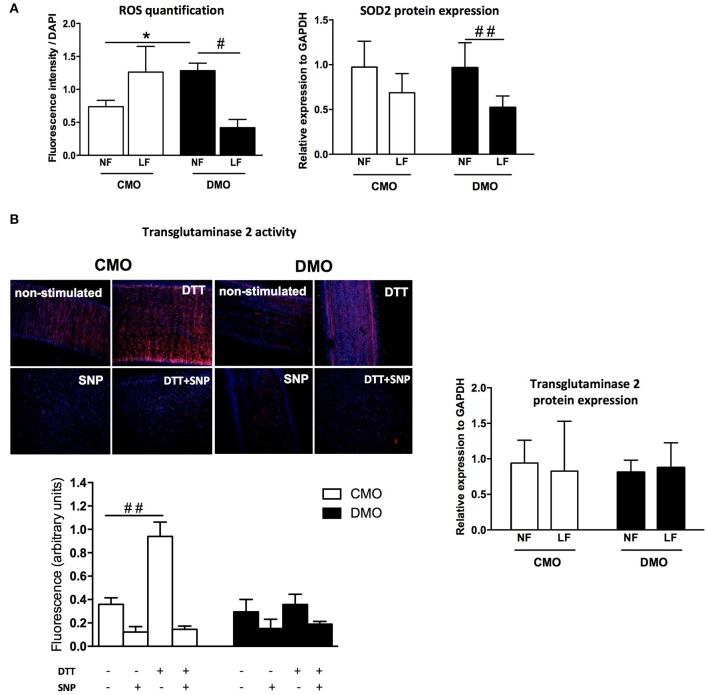
Figure 4.
Oxidative stress and transglutaminase 2 pathways analysis. (A) Reactive oxygen species (ROS) measurement by detection of the number of fluorescent nuclei relative to superoxide production level (left panel) and western blot analysis of mitochondrial superoxide dismutase (SOD2) normalized to GAPDH protein expression (right panel) in normal (NF) and low (LF) flow mesenteric arteries of 3-month old control (CMO, open bars) and diabetic (DMO, solid bars) mother offspring; each bar graph represents mean ± SEM (n = 6 per group). #n < 0.05 and ##n < 0.01 LF vs. NF; *n < 0.05 DMO vs. CMO. (B) Transglutaminase 2 activity (incorporation of Alexa Fluor-594/Cadaverine) measured in non-stimulated mesenteric artery (basal condition), with SNP (NO donor, inhibitor of TG2 activity), with DTT (activator of TG2 activity) or with SNP + DTT in CMO (n = 6) and in DMO (n = 3) rats (left panel) and relative expression of Transglutaminase 2 normalized to GAPDH protein expression (western blot analysis, n = 6 per group) in normal (NF) and low (LF) flow mesenteric arteries of 3-month old control (CMO, open bars) and diabetic (DMO, solid bars) mother offspring; each bar graph represents mean ± SEM. ##p < 0.01 DTT vs. non-stimulated.

