Figure 4.
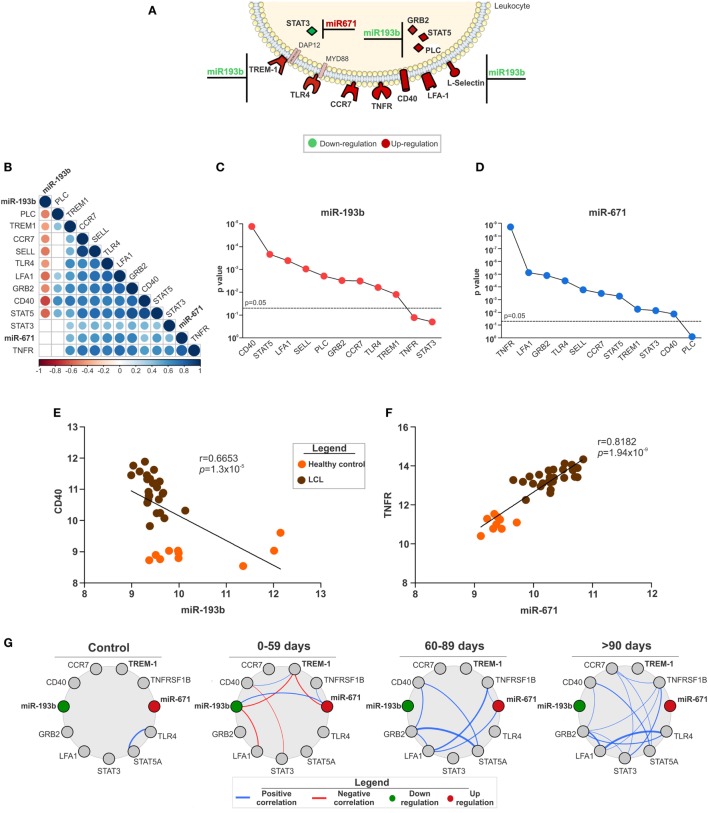
The expression of miR-193b and -671 and their target genes as key in localized cutaneous leishmaniasis (LCL) outcome. (A) Representative image of molecules from innate immune response pathways and their respective microRNAs with opposite expression (↑miR ↓target or ↓miR ↑target). (B) Correlation matrix between the expression of microRNAs and their target genes. Circles and corresponding sizes represent significance (p < 0.05) and r-values for each Spearman correlation, respectively. Colors represent the directionality of the correlation (blue infers positive correlation, whereas red indicates negative correlations). (C) p-Values of negative Spearman correlations between miR-193b and the indicated target genes are shown. (D) p-Values of positive Spearman correlations between miR-671 and the indicated target genes are described. Spearman correlations between (E) miR-193b/CD40 and (F) miR-671/TNFR. (G) Network analysis shows Spearman correlations (−0.6 < r > 0.6) between microRNAs and target genes according to the response to treatment (cured by 59, 60–89 or >90 days). Colors represent the directionality of the correlation (red line, negative correlation and blue line, positive correlation; red circles, upregulated and green circles, downregulated genes).

