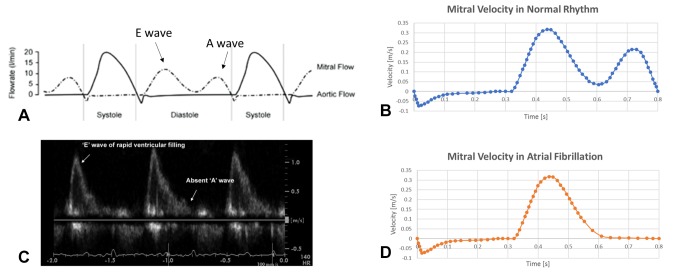
Figure 2.
Boundary condition imposed in normal (top panel) and pathological (bottom panel) conditions. (A) flow rate across the mitral valve for a healthy generic subject (28): the atrial emptying phase (shown as ventricular diastole in the picture) is divided into E wave – representing the early atrial systole – and A wave – representing the atrial contraction. (B) Mitral valve velocity derived from the flow rate represented in (A) by dividing for the mitral valve orifice area, which was then imposed as boundary outlet condition. (C) Echocardiography study showing the lack of A wave in case of AF (29), as atrial contraction is almost absent. (D) Velocity profile derived for the mitral valve orifice in case of AF.

