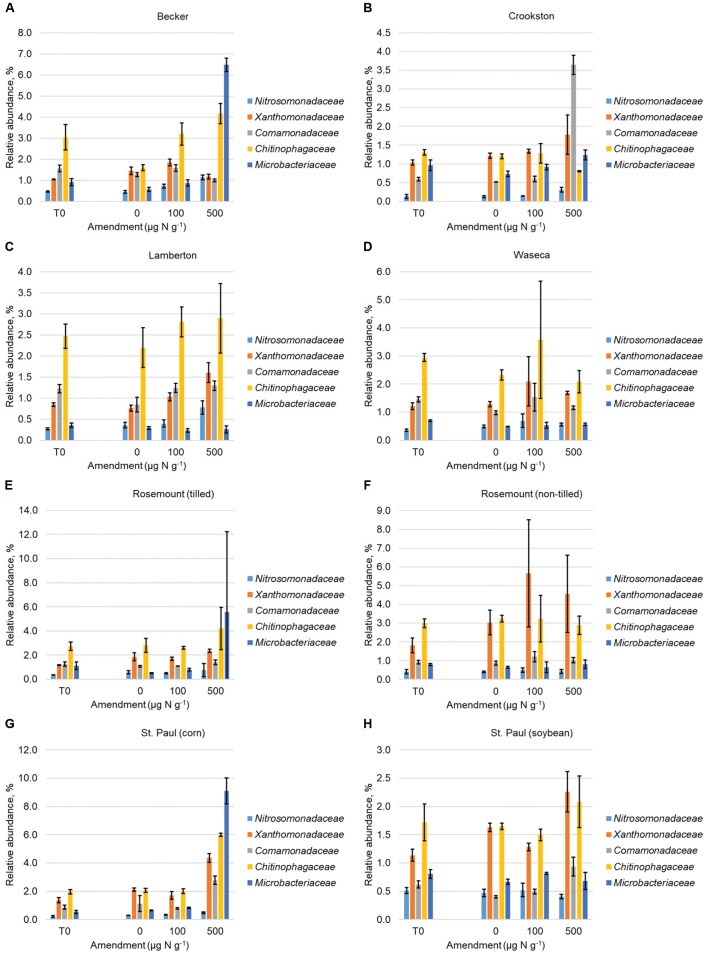
FIGURE 1.
Abundances (mean ± standard deviation) of families to which OTUs that were discriminatory for urea amendment (Supplementary Figure S3) were classified. Abundances are shown prior to urea amendment and at the 21-day time point for each amendment at (A) Becker, (B) Crookston, (C) Lamberton, (D) Waseca, (E) Rosemount (tilled), (F) Rosemount (non-tilled), (G) St. Paul (corn), (H) St. Paul (soybean).

