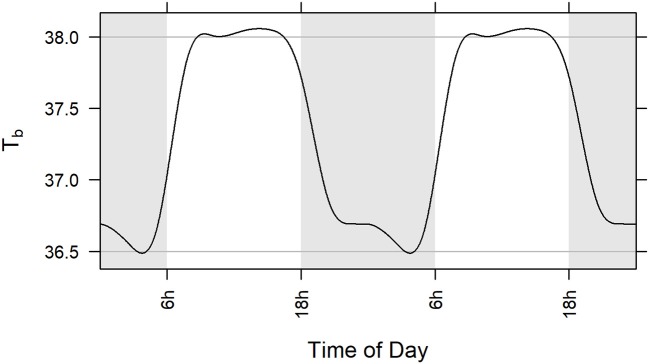
Figure 3.
Population level model (GAM) of circadian rhythm of body temperature in five studies illustrated over two 24-h cycles. Model is based on baseline core body temperature data of all subjects challenged with aerosolized F. tularensis in Studies 1, 2, 3, 4, and 5 (Table 1). Gray lines at 36.5 and 38.0°C represent a range of 1.5°C. Statistical methods used are described in section Materials and Methods.

