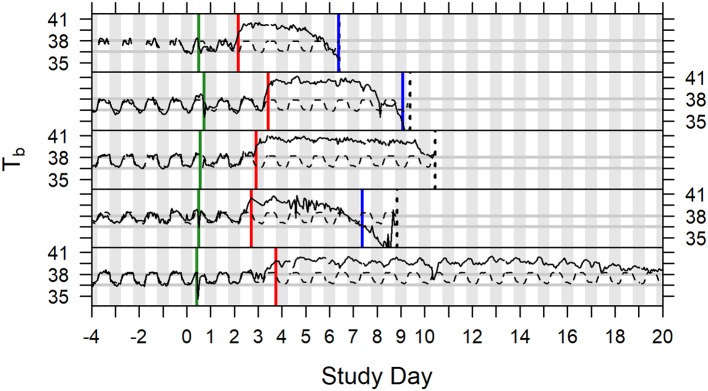
Figure 5.
Time series plots of body temperature for five animals depicted with subject specific model predictions of circadian rhythm, Study Days −4 through 19. Green vertical lines indicate exposure to aerosolized F. tularensis on Study Day 0. Red vertical lines indicate onset of fever. Blue vertical lines indicate onset of hypothermia. Dashed black vertical lines represent the time of death (the fifth subject illustrated survived to the end of the study).

