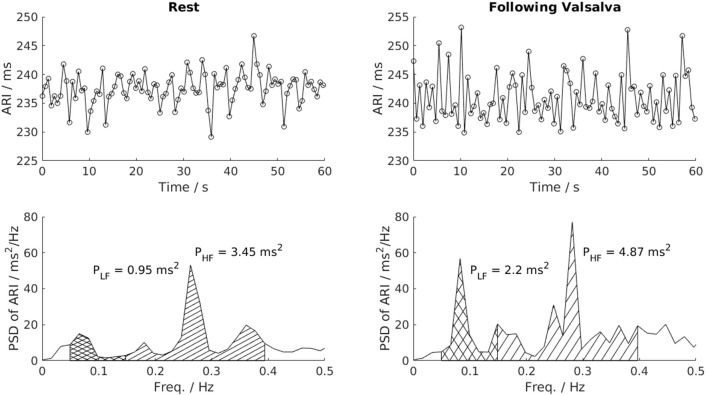
Figure 2.
Power spectral analysis of low-frequency (LF, 0.04–0.15 Hz) and high-frequency (HF, 0.15–0.4 Hz) variability. This example shows a clear increase of LF variability of ARI in one patient following the Valsalva. PSD, Power spectrum density; PLF, low frequency power; PHF, high frequency power.

