Figure 5.

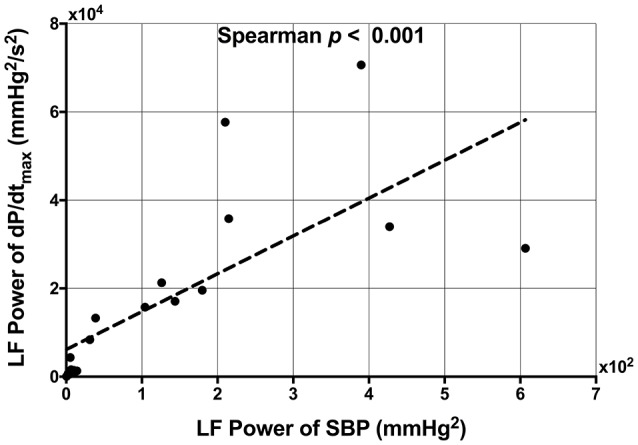
Scatterplot demonstrating the significant correlation between low frequency (LF) power of systolic blood pressure (SBP) and the LF power of the maximum rate of systolic pressure increase (dP/dtmax).

Scatterplot demonstrating the significant correlation between low frequency (LF) power of systolic blood pressure (SBP) and the LF power of the maximum rate of systolic pressure increase (dP/dtmax).