Figure 6.

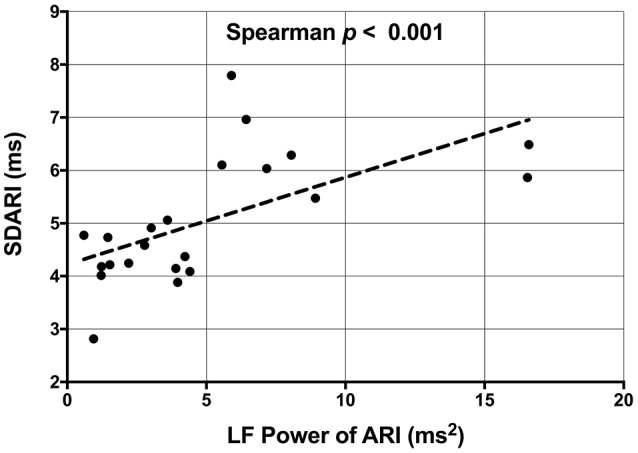
Scatterplot demonstrating the significant correlation between the low frequency (LF) power of activation recovery intervals (ARIs) and the beat-to-beat variability of ARI (SDARI).

Scatterplot demonstrating the significant correlation between the low frequency (LF) power of activation recovery intervals (ARIs) and the beat-to-beat variability of ARI (SDARI).