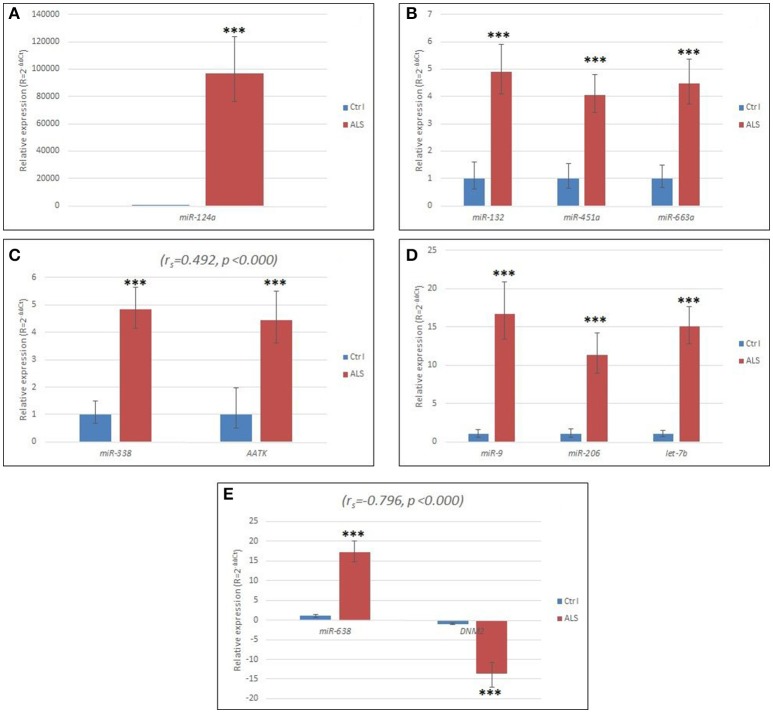
Figure 1.
(A) Relative expression of miR-124 in sALS patients compared to controls. (B) Relative expression of miR-132, miR-451a, and miR-663a, respectively, in sALS patients compared to controls. (C) Relative expression of miR-338 and its host gene AATK in sALS patients compared to controls. (D) Relative expression of miR-9, miR-206, and let-7b, respectively in sALS patients compared to controls. (E) Relative expression of miR-638 and its host gene DNM2 in sALS patients compared to controls. Ctrl, control group; ΔCt, delta Ct; ΔΔCt, delta delta Ct; sALS, sporadic amyotrophic lateral sclerosis; ***p < 0.000. Horizontal lines represent standard deviation.

