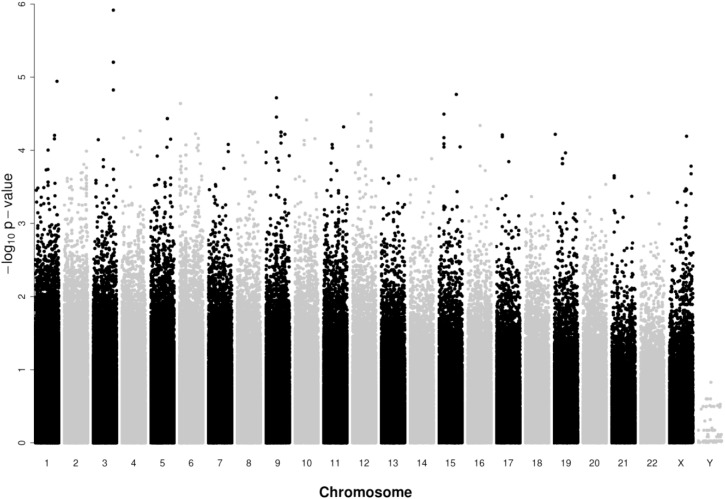
FIGURE 2.
Manhattan plot of genome-wide association results for the discovery VIRSTA cohort. The x-axis represents the chromosome number and the y-axis shows the P-values in – log10 scale. Dot represent SNP. A total of 67 cases and 72 controls are compared. 631,710 SNPs that passed all quality control filters are presented. As indicated in Table 2, two SNPs on chromosome 3 have the same p-value; these two points overlap in present figure.

