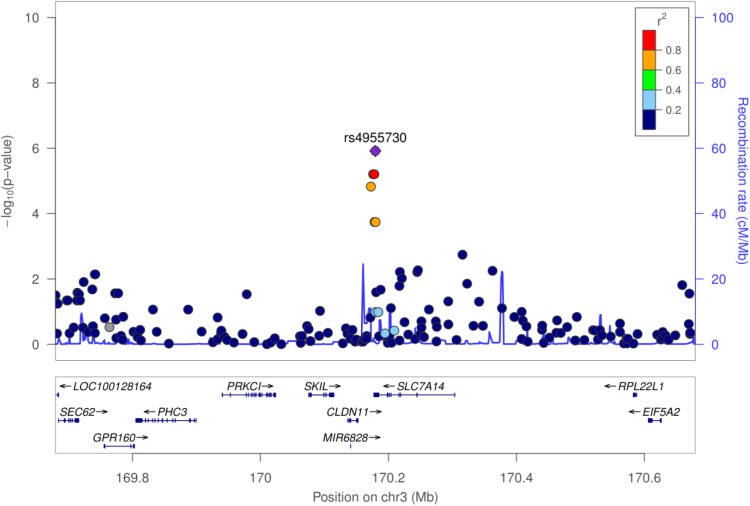
FIGURE 3.
Regional association plot of the SaIE susceptibility locus on chromosome 3. The y axis shows the P-values in –log10 scale for SNPs up- and downstream of the sentinel SNP (purple dot). The extent of linkage disequilibrium (LD; r2 values) for all SNPs with the sentinel SNP is indicated by colors. The location of genes is shown at the bottom.

