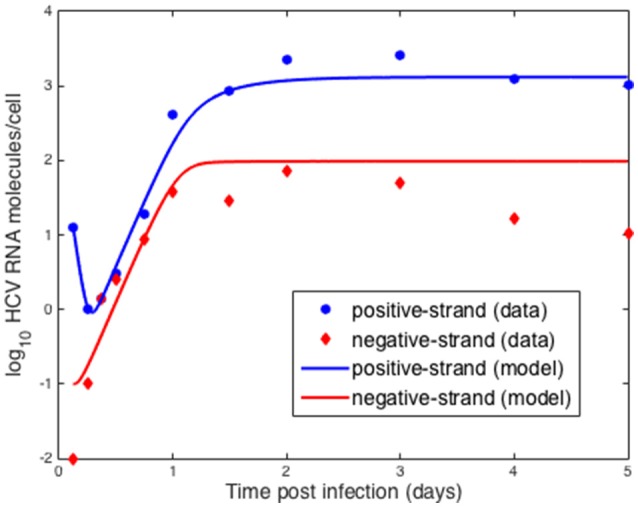
Figure 6.

Comparison of model results to in vitro infection data. Data points were extracted from Keum et al. (2012) and the lines were obtained by fitting the intracellular model to the data where we assumed the measured positive strands were the sum of the positive strands used for translation, Rt and in replication complexes, Rc. As before we fixed the export rate with ρ = 0.1 d−1, τ = 0.5 d−1, and k = 0.8 d−1. The initial time t0 = 0. Based on the data we set Rt0 = 12.8. Other parameters were estimated and were found to be α = 30 d−1, μt = 24 d−1, r = 3.18 d−1, μc = 1.05 d−1, Rmax = 100 molecules, σ = 0.1 d−1 and θ = 1.2 d−1.
